 Listen to text
 MP3
MP3Air travel complaints per 100 flights, by airline, April 2022 to June 2023
Context
- The tables include airlines with an average of 1 or more complaints per 100 flights to/from/within Canada submitted to the CTA during 1 of the quarterly periods. Airlines that did not meet this criteria, or that did not operate at least 100 flights over the reporting periods, are not included on the list.
- The complaint data is based on the information submitted by passengers and may not have been reviewed by the CTA at the time of publishing.
- Complaints are submitted to the CTA after the passenger has attempted to resolve the issue directly with the airline. Airlines have 30 days to respond to the passenger.
- The data is based on the number of flights by airline and does not reflect the number of passengers per flight or the size of the aircraft.
- The data used for this dashboard is based on all of the air travel complaints submitted to the CTA; the numbers do not imply whether or not an airline actually met its regulatory requirements.
- Airlines identified in the complaint may change based on the information supplied by the passenger and the airline during the complaint review process.
- Complaints related to accessibility are not included in these tables.
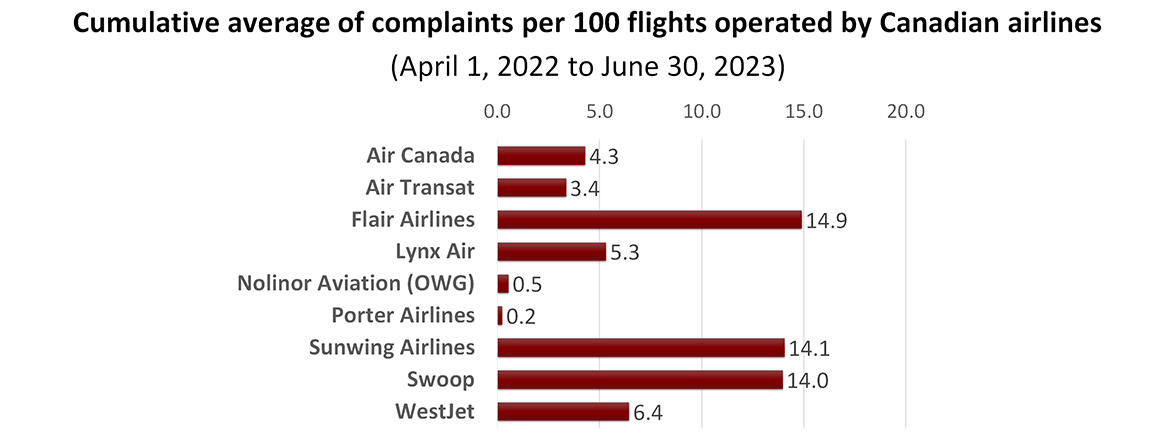
Number of complaints per 100 flights operated by Canadian airlines
April 1, 2022 to June 30, 2023, by quarter
| Canadian airline | Current quarter Apr to Jun 2023 |
Jan to Mar 2023 | Oct to Dec 2022 | Jul to Sep 2022 | Apr to Jun 2022 | Cumulative average Apr 2022 to Jun 2023 |
|---|---|---|---|---|---|---|
| Air Canada | 4.3 | 5.7 | 4.1 | 6.4 | 1.0 | 4.3 |
| Air Transat | 3.5 | 4.3 | 4.5 | 3.0 | 1.5 | 3.4 |
| Flair Airlines | 12.6 | 20.8 | 13.2 | 18.4 | 9.6 | 14.9 |
| Lynx Air | 5.1 | 4.9 | 6.6 | 7.7 | 2.4 | 5.3 |
| Nolinor Aviation (OWG) | 0.0 | 1.7 | 1.0 | — | — | 0.5 |
| Porter Airlines | 1.1 | — | — | — | — | 0.2 |
| Sunwing Airlines | 14.5 | 17.2 | 20.9 | 9.6 | 8.1 | 14.1 |
| Swoop | 16.6 | 16.0 | 11.7 | 18.7 | 6.9 | 14.0 |
| WestJet | 6.0 | 10.6 | 5.6 | 6.0 | 4.0 | 6.4 |
| Source: The complaints data is compiled by the CTA. The number of flights operated per airline during the time period is provided by a third party (Cirium). | ||||||
Graphic version of the cumulative average number of complaints per 100 flights operated by Canadian airlines from April 1, 2022 to June 30, 2023
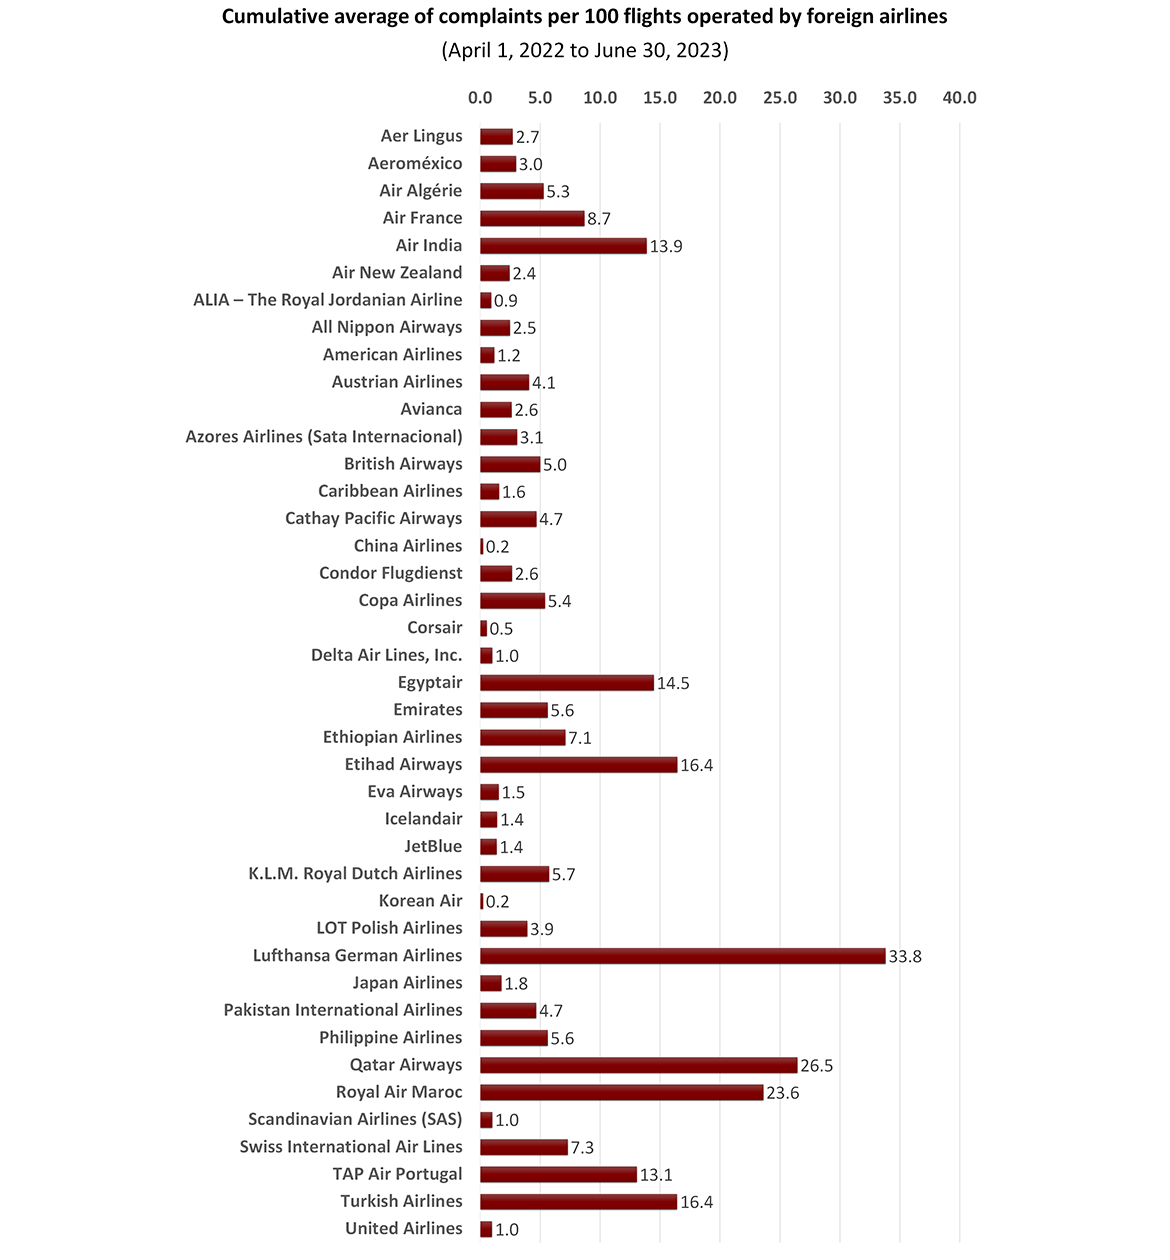
Number of complaints per 100 flights operated by foreign airlines
April 1, 2022 to June 30, 2023, by quarter
| Airline | Current quarter Apr to Jun 2023 |
Jan to Mar 2023 | Oct to Dec 2022 | Jul to Sep 2022 | Apr to Jun 2022 | Cumulative average Apr 2022 to Jun 2023 |
|---|---|---|---|---|---|---|
| Aer Lingus | 3.3 | 4.3 | — | 4.9 | 1.1 | 2.7 |
| Aeroméxico | 4.0 | 3.3 | 2.2 | 2.8 | 2.6 | 3.0 |
| Air Algérie | 7.6 | 12.0 | 1.6 | 2.5 | 2.6 | 5.3 |
| Air France | 8.5 | 13.1 | 11.2 | 7.8 | 2.8 | 8.7 |
| Air India | 13.3 | 14.1 | 13.8 | 15.1 | 13.1 | 13.9 |
| Air New Zealand | 8.3 | 2.1 | 1.9 | — | — | 2.4 |
| ALIA – The Royal Jordanian Airline | 1.5 | — | — | 3.0 | — | 0.9 |
| All Nippon Airways | 1.7 | 3.3 | 4.9 | 2.4 | — | 2.5 |
| American Airlines | 1.4 | 1.6 | 1.4 | 1.5 | — | 1.2 |
| Austrian Airlines | 11.7 | — | — | 6.9 | 1.8 | 4.1 |
| Avianca | 3.3 | 3.4 | 2.5 | 1.1 | 2.8 | 2.6 |
| Azores Airlines (Sata Internacional) | 2.2 | 6.6 | 3.6 | 1.5 | 1.5 | 3.1 |
| British Airways | 4.1 | 6.1 | 6.0 | 6.6 | 2.1 | 5.0 |
| Caribbean Airlines | 4.0 | 2.5 | — | — | 1.3 | 1.6 |
| Cathay Pacific Airways | 8.6 | 4.9 | 3.9 | 6.0 | — | 4.7 |
| China Airlines | 0.0 | 1.1 | — | — | — | 0.2 |
| Condor Flugdienst | 3.8 | — | — | 6.7 | 2.7 | 2.6 |
| Copa Airlines | 3.4 | 7.3 | 6.8 | 5.1 | 4.3 | 5.4 |
| Corsair | 0.0 | — | — | 2.7 | — | 0.5 |
| Delta Air Lines, Inc. | 1.4 | 1.5 | 1.2 | 1.0 | — | 1.0 |
| Egyptair | 25.2 | 11.9 | 11.8 | 15.7 | 7.9 | 14.5 |
| Emirates | 5.8 | 7.0 | 5.3 | 3.8 | 6.2 | 5.6 |
| Ethiopian Airlines | 6.9 | 9.4 | 8.3 | 5.3 | 5.6 | 7.1 |
| Etihad Airways | 22.3 | 17.4 | 15.2 | 15.8 | 11.5 | 16.4 |
| Eva Airways | 1.9 | 3.9 | 1.9 | — | — | 1.5 |
| Icelandair | 2.0 | 3.6 | 1.4 | — | — | 1.4 |
| Japan Airlines | 2.2 | 4.4 | 2.2 | — | — | 1.8 |
| JetBlue | 0.0 | — | 4.0 | 2.8 | — | 1.4 |
| K.L.M. Royal Dutch Airlines | 4.6 | 9.5 | 8.0 | 3.4 | 3.3 | 5.7 |
| Korean Air | 1.1 | — | — | — | — | 0.2 |
| LOT Polish Airlines | 3.2 | 4.4 | 5.3 | 4.5 | 2.2 | 3.9 |
| Lufthansa German Airlines | 13.3 | 86.0 | 52.1 | 13.2 | 4.5 | 33.8 |
| Pakistan International Airlines | 5.9 | 11.5 | 4.4 | 1.6 | — | 4.7 |
| Philippine Airlines | 9.5 | 6.8 | 4.8 | 3.9 | 3.2 | 5.6 |
| Qatar Airways | 29.9 | 25.7 | 24.5 | 33.0 | 19.2 | 26.5 |
| Royal Air Maroc | 30.6 | 32.8 | 26.8 | 14.9 | 13.0 | 23.6 |
| Scandinavian Airlines (SAS) | 0.0 | — | — | 5.0 | — | 1.0 |
| Swiss International Air Lines | 6.7 | 10.9 | 12.7 | 6.3 | — | 7.3 |
| TAP Air Portugal | 9.8 | 17.4 | 13.8 | 13.1 | 11.2 | 13.1 |
| Turkish Airlines | 16.6 | 20.0 | 15.2 | 16.1 | 14.1 | 16.4 |
| United Airlines | 1.1 | 1.7 | 1.0 | 1.2 | — | 1.0 |
| Source: The complaints data is compiled by the CTA. The number of flights operated per airline during the time period is provided by a third party (Cirium). | ||||||
Graphic version of the cumulative average number of complaints per 100 flights operated by foreign airlines from April 1, 2022 to June 30, 2023
- Date modified: