This node 572279 is published parle_debug=field_parle_speak boolean = FALSE (unchecked or not configured)
Air travel complaints per 100 flights – by airline – October 2022 to December 2023
Context
- The tables include airlines with an average of 1 or more complaints per 100 flights to/from/within Canada submitted to the CTA during 1 of the quarterly periods. Airlines that did not meet this criteria, or that did not operate at least 100 flights over the reporting periods, are not included on the list.
- The complaint data is based on the information submitted by passengers and may not have been reviewed by the CTA at the time of publishing. Data from previous quarters is adjusted when complaints are identified as incorrect submissions.
- Complaints are submitted to the CTA after the passenger has attempted to resolve the issue directly with the airline. Airlines have 30 days to respond to the passenger.
- The data is based on the number of flights by airline and does not reflect the number of passengers per flight or the size of the aircraft.
- The data used for this dashboard is based on all of the air travel complaints submitted to the CTA; the numbers do not imply whether or not an airline actually met its regulatory requirements.
- Airlines identified in the complaint may change based on the information supplied by the passenger and the airline during the complaint review process.
- Complaints related to accessibility are not included in these tables.
Note
On September 30, 2023, Parliament gave the CTA the power to enhance and simplify the way it handles air travel complaints. This includes a more detailed complaint form that guides the passenger on the criteria for eligible complaints. The result is that fewer invalid or ineligible complaints may be submitted, which could impact the comparability between quarters.
Number of complaints per 100 flights operated by Canadian airlines
October 2022 to December 2023, by quarter
| Airline | Fiscal year 2023 to 2024 | Fiscal year 2022 to 2023 | Average | |||
|---|---|---|---|---|---|---|
| October to December (last quarter) (Q3) |
July to September (Q2) |
April to June (Q1) |
January to March (Q4) |
October to December (Q3) |
||
| Air Canada | 4.9 | 5.3 | 4.2 | 5.7 | 4.1 | 4.8 |
| Air Transat | 2.3 | 2.3 | 3.5 | 4.3 | 4.5 | 3.4 |
| Canada Jetlines | 3.2 | — | 7.6 | — | — | 5.4 |
| Flair Airlines | 11.1 | 10.7 | 12.2 | 20.7 | 13.1 | 13.6 |
| Lynx Air | 15.2 | 14.5 | 4.9 | 5.2 | 6.1 | 9.2 |
| Nolinor Aviation (OWG) | — | — | — | 1.7 | — | 1.7 |
| Porter Airlines | 1.2 | 1.2 | 1.1 | — | — | 1.2 |
| Sunwing Airlines | 8.6 | 16.8 | 14.5 | 17.1 | 20.6 | 15.5 |
| Swoop | 17.8 | 7.1 | 16.2 | 15.8 | 11.6 | 13.7 |
| WestJet | 4.2 | 4.6 | 5.9 | 10.4 | 5.6 | 6.1 |
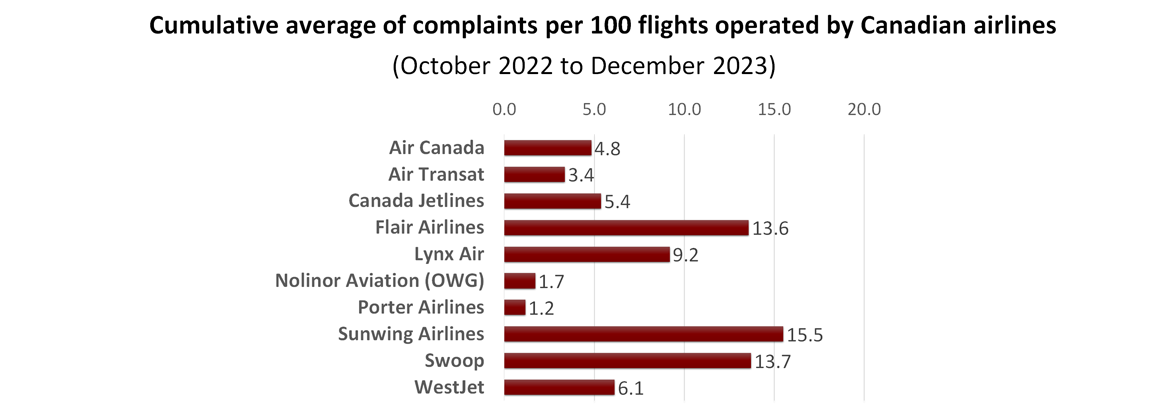
Bar graph: cumulative average number of complaints per 100 flights operated by Canadian airlines from October 2022 to December 2023
Number of complaints per 100 flights operated by foreign airlines
October 2022 to December 2023, by quarter
| Airline | Fiscal year 2023 to 2024 | Fiscal year 2022 to 2023 | Average | |||
|---|---|---|---|---|---|---|
| October to December (last quarter) (Q3) |
July to September (Q2) |
April to June (Q1) |
January to March (Q4) |
October to December (Q3) |
||
| Aer Lingus | 3.3 | 1.1 | 3.3 | 4.3 | 1.3 | 2.7 |
| Aeroméxico | 1.9 | 2.4 | 4.3 | 3.3 | 2.7 | 2.9 |
| Air Algérie | 5.4 | 6.5 | 7.6 | — | 1.6 | 5.3 |
| Air France | 13.8 | 7.5 | 9.0 | 13.9 | 2.0 | 9.2 |
| Air India | 17.5 | 13.9 | 13.3 | 14.1 | 13.2 | 14.4 |
| Air New Zealand | 2.2 | 3.7 | 7.5 | 2.7 | 1.9 | 3.6 |
| ALIA – The Royal Jordanian Airline | — | 2.6 | 1.5 | — | — | 2.0 |
| All Nippon Airways | 2.2 | — | 2.8 | 3.3 | 4.9 | 3.3 |
| American Airlines | 1.9 | 1.9 | 1.3 | 1.6 | 1.4 | 1.6 |
| Austrian Airlines | — | 4.9 | 1.8 | — | — | 3.3 |
| Avianca | 2.7 | 3.0 | 3.3 | 3.4 | 2.5 | 3.0 |
| Azores Airlines (Sata Internacional) | 6.8 | 4.9 | 1.6 | 5.7 | 3.6 | 4.5 |
| British Airways | 6.3 | 2.8 | 4.4 | 5.7 | 5.6 | 5.0 |
| Caribbean Airlines | 3.3 | 3.1 | 4.0 | 2.5 | — | 3.2 |
| Cathay Pacific Airways | 4.7 | 4.9 | 7.2 | 4.7 | 3.6 | 5.0 |
| China Airlines | 2.7 | — | — | 1.1 | — | 1.9 |
| Condor Flugdienst | 15.8 | 3.1 | 3.8 | — | — | 7.6 |
| Copa Airlines | 2.1 | 1.3 | 2.6 | 6.9 | 6.8 | 3.9 |
| Corsair | — | 1.1 | — | — | — | 1.1 |
| Delta Air Lines, Inc. | 1.7 | 1.3 | 1.1 | 1.1 | — | 1.3 |
| Egyptair | 2.6 | 16.8 | 23.2 | 11.9 | 12.6 | 13.4 |
| Emirates | 3.5 | 3.6 | 4.7 | 5.5 | 5.3 | 4.5 |
| Ethiopian Airlines | 1.5 | 5.3 | 6.9 | 9.4 | 8.3 | 6.3 |
| Etihad Airways | 13.6 | 12.0 | 21.7 | 16.8 | 15.8 | 16.0 |
| Eva Airways | 2.2 | 3.5 | 1.9 | 3.9 | 1.9 | 2.7 |
| Icelandair | 1.5 | 1.2 | 2.4 | 3.6 | 1.4 | 2.0 |
| Japan Airlines | 1.6 | — | 2.2 | 3.3 | 1.7 | 2.2 |
| JetBlue | 7.7 | 5.9 | 1.9 | 2.3 | 6.3 | 4.8 |
| K.L.M. Royal Dutch Airlines | 8.8 | 4.1 | 4.7 | 9.6 | 8.0 | 7.0 |
| Korean Air | 2.0 | — | — | — | — | 2.0 |
| LOT Polish Airlines | 11.7 | 4.2 | 2.8 | 3.3 | 5.3 | 5.4 |
| Lufthansa German Airlines | 18.6 | 12.7 | 12.9 | 84.6 | 52.7 | 36.3 |
| Pakistan International Airlines | 7.7 | 5.7 | 5.8 | 1.7 | 4.4 | 5.1 |
| Philippine Airlines | 7.2 | 13.7 | 9.5 | 6.3 | 4.8 | 8.3 |
| Qatar Airways | 16.1 | 21.7 | 3.4 | 26.8 | 11.7 | 16.0 |
| Royal Air Maroc | 24.8 | 18.6 | 29.3 | 32.8 | 26.8 | 26.5 |
| Swiss International Air Lines | 9.6 | 6.3 | 6.0 | 1.9 | 12.5 | 7.3 |
| TAP Air Portugal | 7.3 | 9.1 | 9.5 | 17.5 | 13.1 | 11.3 |
| Turkish Airlines | 17.8 | 15.2 | 17.6 | 19.7 | 15.2 | 17.1 |
| United Airlines | 1.7 | 1.8 | — | 1.4 | — | 1.6 |
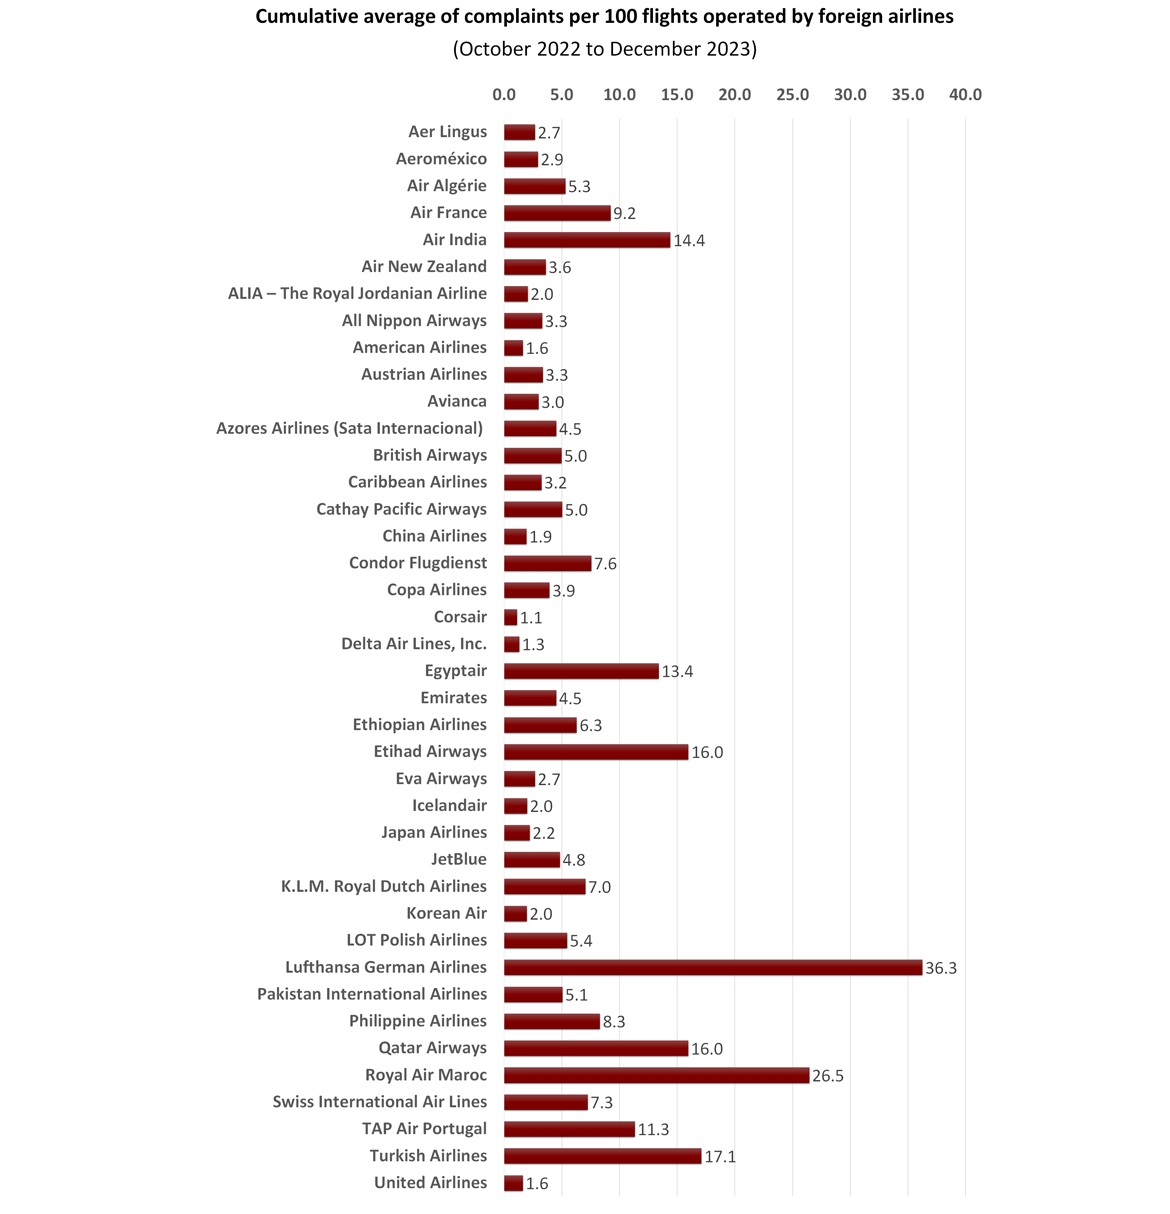
Bar graph: cumulative average number of complaints per 100 flights operated by foreign airlines from October 2022 to December 2023
- Date modified: