Discussion Paper on the CTA Approach to Setting Regulated Interswitching Rates
Table of contents
Introduction
On November 30, 2018, the Canadian Transportation Agency (CTA) issued Determination No. R-2018-254, setting the regulated interswitching rates for 2019. This determination – involving the first revision of regulated interswitching rates since 2013 – represents an important first step in implementing an updated approach to setting regulated interswitching rates.
Interswitching is a practice that gives some shippers access to the services of railway companies that do not directly serve their facilities or sidings, by requiring that a railway company that does provide such direct service transfer cars with a shipper’s traffic at an interchange to a different railway company with which the shipper has made transportation arrangements. While interswitching is a long-standing practice in Canada's rail sector – and has been regulated by the CTA since 1904 – recent amendments to the Canada Transportation Act (the Act) have changed the process by which regulated interswitching rates are set and communicated by the CTA.
Under amendments to the Act made by the Transportation Modernization Act, which received Royal Assent on May 23, 2018, the CTA is required to set the rates by no later than December 1st of every year (subsection 127.1(1)); take into consideration any long-term investment needed in the railway (paragraph 127.1(2)(b)); publish the method that it followed for determining the rates (subsection 127.1(4)); and publish the rates in the Canada Gazette no later than December 31st of the calendar year preceding the year that the rates take effect (subsection 127.1(5)). These amendments will help ensure that changes to the rates are established and communicated in a timely and transparent manner.
Other provisions of the Act continue to apply when the CTA sets regulated interswitching rates. For example, in setting a regulated interswitching rate, the CTA must consider any reduction in costs that results from moving a greater number of cars or transferring several cars at the same time (subsection 127.1(2)(a)). In addition, it must consider the average variable costs of all movements of traffic that are subject to the rate, and the rate cannot be less than the variable costs of moving the traffic, as determined by the CTA (subsection 127.1(3)). Finally, in setting regulated interswitching rates, the CTA must have regard to the requirement, stated in section 112 of the Act, that a rate it sets must be commercially fair and reasonable to all parties.
In the November 30, 2018 determination, the CTA described the methodology it used to calculate the 2019 interswitching rates within the framework of the Act. The CTA also signaled its intention to hold consultations on this methodology, stating:
"These consultations will examine a broad range of methodological questions and factors, including car block categories, regional rates, rates developed for federally-regulated short-line railway companies, and the [Agency's] cost of capital methodology."
This discussion paper provides a framework for consultation on the CTA's regulated interswitching rate-setting methodology. It outlines the process by which regulated interswitching rates are established and poses a number of specific questions for feedback on key topics.
The CTA's review of the regulated interswitching rate methodology includes the potential for changes to the Railway Interswitching Regulations (Interswitching Regulations). The Interswitching Regulations prescribe more detailed requirements for the CTA in establishing rates, including the distance zones for which regulated interswitching rates are set, and how block car traffic is accounted for. Interswitching distance zones will not be extended beyond 30 km as a result of this consultation, as there is no authority for the CTA to do so. However, it is possible that the methodology for calculating rates for different zones could be adjusted, or the measurement of the four zones could be changed (for example, a single zone could potentially be used rather than four).
As outlined below, the CTA is seeking input on various issues that inform how regulated interswitching rates are calculated. The first four issues for discussion cover whether any adjustments are warranted to address unique circumstances: the activities of short-line railway companies; regional and/or commodity-specific considerations; differences in customer characteristics, rates or other factors in different zones; and, finally, block car shipping.
The next three issues relate to costing methodology (which are relevant not only to interswitching, but also for other regulatory purposes such as the Maximum Revenue Entitlement program): the CTA's cost of capital methodology; contribution to fixed costs; and productivity factors.
Finally, the CTA is soliciting feedback on how service units are collected by the CTA for the purpose of calculating the regulated interswitching rates; and any other elements that may help to achieve greater transparency in setting and applying regulated interswitching rates, including separate line items for interswitching in billing practices.
While some issues raised during consultations could potentially be addressed in time for the 2020 Interswitching decision (which must be issued by December 1, 2019), others, such as those involving changes to the Interswitching Regulations, would take more time to implement. In general, regulatory changes take 18-24 months, depending on their complexity. Other potential adjustments to the methodology may require an affected railway company to file additional information with the CTA, which, in turn, would impact the timeline for when changes would be reflected in a CTA determination.
The CTA will consider all input carefully in determining next steps – including any regulatory changes – with a view to ensuring that rates are compensatory, consider the long-term investment needs of railway companies, and are commercially fair and reasonable to all parties.
Consultation process
You are invited to submit your input to the questions posed in this discussion paper, as well as any additional comments you may wish to provide, by August 20, 2019. You are invited to respond to all questions, or simply those questions that are of interest to you or your organization. Your responses to the questions should include a supporting rationale. Input can be sent to ferroviaire-rail@otc-cta.gc.ca.
If you wish to submit a video due to accessibility issues, please send an email to ferroviaire-rail@otc-cta.gc.ca with the subject line "Video". We will contact you to coordinate your submission.
If your submission contains information that you believe should be treated as confidential, two versions of your document must be filed:
- a confidential version of the document in which:
- each page is marked "contains confidential information" at the top, and
- on each page, you identify, by highlighting or other means, the confidential information that was redacted from the public version.
- a public version of the document from which the confidential information has been redacted.
All submissions are subject to the Access to Information Act and Privacy Act, whose provisions may or may not allow for the information claimed as confidential to be kept out of the public domain if a request for their release is filed.
All public versions will be posted on the CTA's website in the official language in which they were submitted, along with your name or that of the organization represented.
Overview of current methodology
The regulated interswitching rates are set for distance zones established in the Interswitching Regulations. The Interswitching Regulations currently contain four distance zones which are summarized in Appendix A to this discussion paper.
Appendix A of Determination No. R-2018-254 sets out the methodology by which the CTA established regulated interswitching rates for 2019. Briefly, the 2019 regulated interswitching rates calculated by the CTA are based on a methodology that captures the economic costs of providing interswitching services. These economic costs include explicit costs such as operating costs, including the depreciation of assets, as well as the implicit costs associated with the returns on investment in those assets. The returns on investment are a weighted average of the returns on debt and the returns on equity, and are determined by the CTA according to its cost of capital methodology, which was reviewed in a comprehensive consultation and established by the CTA in Decision No. 425-R-2011 (2011 cost of capital decision). For explanatory purposes, the CTA has calculated regulated interswitching rates based on the following simplified formula:
Interswitching rates = (A x B) x C/D
Where:
- A is interswitching variable costs
- B is contribution to fixed costs
- C is a factor to account for price inflation, and
- D is a productivity adjustment factor
Interswitching variable costs are expressed as:
Interswitching variable costs(A) = (E/F x G) x H
Where:
- E is system costs
- F is system service units
- G is variability of costs, and
- H is interswitching service units
As outlined in Determination No. R-2018-254, the CTA's methodology builds on available data and previous jurisprudence. However, within the framework of the Act, there is the possibility for different approaches. For example, short-line railway companies have raised concerns that the regulated interswitching rates do not reflect their costs. Questions have been raised as to whether their cost structure should be taken into account, or even if separate rates should be established for these railway companies.
To give another example, prior to 2010, the CTA used linear regression techniques to ensure that rates increased proportionally with a distance to the interchange. However, in 2010, the CTA eliminated the application of these techniques with a view to ending the cross subsidization of rates amongst shippers and amongst railway companies. This has produced interswitching rates that are no longer proportional to distance. Some would say that distance is the most meaningful determinant of costs, while others would say that costs are primarily driven by other factors.
These, and other issues, are discussed below.
Issue 1: Federally regulated short-line railway companies
The regulated interswitching rates are currently calculated solely from the costs of the Canadian National Railway Company (CN) and the Canadian Pacific Railway Company (CP). Stakeholders have suggested that this is a fundamental flaw in the methodology, as it does not align with short-line railway companies' unique cost structure. Short-line railway companies have expressed concerns that the CTA's regulated rates are not reflective of their costs, that short-line railway companies may have lower labour costs than larger railway companies, but because of generally lower traffic volumes, they cannot benefit from the economies of scale enjoyed by CN and CP.
In order for the CTA to determine regulated interswitching rates that account for the costs of federally regulated short-line railway companies, the CTA would need to determine the system costs and measure the interswitching activities performed by the participating short-line railway companies. This would require those railway companies to submit to the CTA, annually, their system costs and operating statistics as defined in the Uniform Classification of Accounts, and also provide annual data that would allow the CTA to measure the service units they perform in interswitching service. In the past, the CTA has been of the opinion that, as the overwhelming majority of interswitching cars are moved by CN and CP, the potential increase in accuracy of the rates by including short-line railway companies may not be worth the reporting burden on the participating short-line railway companies.
Question 1:
(a) Should separate regulated interswitching rates be determined for short-line railway companies? If yes, should there be rates for individual short-line railway companies or one single average for all short-line railway companies?
(b) Should the CTA expand the current regulated interswitching rate development methodology to include the interswitching service units performed by and the unit costs of participating short-line railway companies?
(c) Should the CTA continue to rely solely on the costs of CN and CP to develop the regulated interswitching rates?
Please provide a rationale for each of your responses.
Issue 2: Regional and commodity-specific regulated interswitching rates
The CTA currently averages the interswitching costs determined for individual shippers to a national average interswitching rate using weighted averages based on the numbers of interswitching cars moved. A national average interswitching rate is easy to administer and places the least burden on both railway companies and shippers.
However, some stakeholders have argued that a national average rate is not consistently compensatory, depending on the geographic area where the movement was performed and other factors, and the rates do not provide an adequate contribution to fixed costs. One reason for this, according to the railway companies, is that the rates are set using a system-wide average of the railway companies' costs. They also suggest that the relatively low cost of interswitching in certain locales brings down the "average" cost, to the detriment of railway companies performing frequent switches in locales where the costs of doing so are much higher.
A system-wide average rate of all commodities may lead to some "low cost" terminals subsidizing "high cost" terminals. For example, in the grain sector, many terminals or elevators are emptied or filled utilizing automation equipment or their own track mobiles. A railway company serving a grain terminal will place the cars at a siding, and the terminals will load or empty the cars using their own equipment while the railway company’s equipment and crew will either remain on standby with the locomotives at the terminal location, or serve other customers elsewhere.
Some commodities, such as dangerous goods, must be transported according to detailed regulations or specific customer requested placement of cars. This requires extra handling time by the railway companies compared to some other commodities, which in turn, increases costs.
Question 2:
(a) Should the CTA continue to determine a single rate in each zone, to maintain the simplicity and ease of administration of the interswitching remedy, or should the CTA determine multiple rates for each zone, to better match the rates to the costs of providing the service?
(b) If multiple rates are preferable, should the rates be by interchange, by province, by region (e.g., Western Canada, Prairies, Eastern Canada) or another alternative?
(c) Should there be different rates for different commodities? If yes, how should the commodities be broken down?
Please provide a rationale for each of your responses.
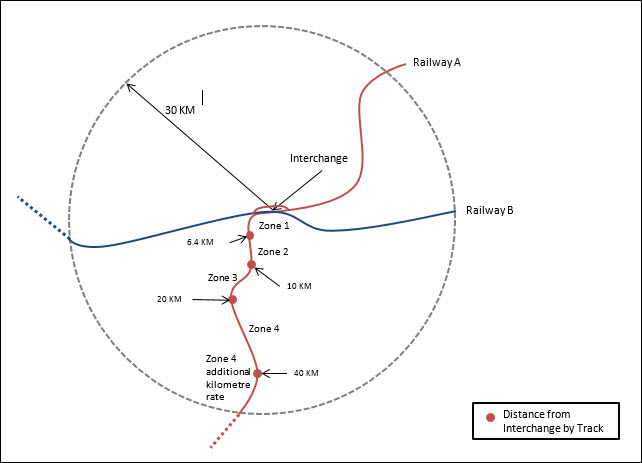
Issue 3: Interswitching zones up to 30 km
The Interswitching Regulations currently define four interswitching zones within the 30 km interswitching eligibility radius, based on the location of a shipper relative to the interchange. Zone 1 is within 6.4 km of the interchange, Zone 2 is between 6.4 km and 10 km, Zone 3 is between 10 km and 20 km, and Zone 4 is greater than 20 km. All distances except the eligibility radius are as measured along the line of track between the shipper and the interchange.
The current interswitching zones were defined in the 1987 Interswitching Regulations.
Smoothing of individual results
In Decision No. LET-R-66-2010, the CTA decided to eliminate the use of linear regression techniques which ensure that the rates increased proportionally with an increase in distance from the interchange. Since the elimination of linear regression to smooth out the results, rates are not linear with the zone distances as set out in the Interswitching Regulations.
The CTA explained that the rates do not necessarily increase proportionally with increases in distance from the interchange due to the fact that the rail network is composed of different grades of track and that customers and their sidings are not identical.
By smoothing the rates, the various shippers (and railway companies) effectively cross-subsidize each other. For example, if we assumed railway companies A and B each handled traffic in 3 zones, but only railway company B handled traffic in zone 4, then a smoothing of the rates that increases the zone 4 rates and slightly reduces the rates for other zones will mean that railway company B is getting more than what the calculated zone 4 cost would produce.
Question 3:
Are the CTA's current distance based interswitching zones sufficient?
Question 4:
Should the CTA introduce more factors, such as customer characteristics, train size, or grades of track characteristics to create a broader range of rates?
Question 5:
Should the CTA collapse the four zones and have one interswitching zone for all customers within the regulated interswitching limits?
Question 6:
Should the CTA reinstitute the use of weighted linear regression to produce rates that increase proportionately by zone?
Please provide a rationale for each of your responses.
Issue 4: Long-term investment needs of the railway companies (cost of capital methodology)
The CTA includes in the regulated interswitching rate, an allowance for the cost of capital of the railway companies. This cost of capital is determined annually by the CTA based on the methodology described in the 2011 cost of capital decision and Determination No. R-2017-198 (2017 determination).
The 2011 cost of capital decision defines the cost of capital as an estimate of the total return on net investment that is required by debt holders and shareholders, so that debt costs can be paid and equity investors can be provided with a return on investment consistent with the risks assumed for the period under consideration.
The Transportation Modernization Act added a requirement, in paragraph 127.1(2)(b) of the Act, which states:
127.1 (2) In determining an interswitching rate, the [Agency] shall take into consideration
(b) any long-term investment needed in the railways.
Determination No. R-2018-254 described how the CTA took into consideration the long-term investment needed in the railways through the cost of capital and depreciation allowance.
In that determination, the CTA stated:
The [Agency’s] interswitching methodology follows the standard [Agency] costing model, which captures the economic costs of providing interswitching service. This serves to capture both the accounting costs and the implicit costs of a railway, including labour costs, fuel costs, material and other costs, and capital costs, which include depreciation of assets, and the returns on investment in those assets.
By comparison, accounting costs only capture the explicit costs of a firm. Accounting costs are the actual cash outlays of a company that is providing a service or good such as labour, fuel and materials. Compensating railway companies with the full economic costs of their operations supports their long-term economic viability in the market. The [Agency] captures the implicit costs of the Canadian National Railway Company (CN) and the Canadian Pacific Railway Company (CP) through the cost of capital allowance and a depreciation allowance in its costing methodology.
The cost of capital is defined as an estimate of the total return on net investment required by debt holders (cost of debt) and shareholders (cost of common equity) such that debt costs can be paid and shareholders can be provided with a return on investment consistent with the risks assumed for the period under consideration.
The cost of debt portion of the cost of capital is measured by the [Agency] using the coupon rate method, which represents the actual interest paid to financial institutions or bond holders for loans made to the railway companies, as recorded in the most recent financial statements of the railway companies. If the allowance for the cost of debt was less than the actual cost of debt paid, the businesses would have difficulty meeting their debt obligations and securing additional debt to fund future long-term investments. On the other hand, if the allowance for the cost of debt was more than the actual cost of debt, this would result in an unjustifiable windfall and not be in keeping with section 112 of the [CTA], which states that a rate established by the [Agency] must be commercially fair and reasonable to all parties.
The cost of the common equity portion of the cost of capital is calculated using the traditional Capital Asset Pricing Model (CAPM) as presented in the 2011 cost of capital decision. From 2009‑2011, the [Agency] conducted a comprehensive public review of different cost of common equity models including the Discounted Cash Flow (DCF) Model, the Equity Risk Premium Model, and combinations of different models including the averaging of the CAPM and the multi‑stage DCF Model. After reviewing the merits of all models, as well as considering stakeholder views, the [Agency] concluded that the traditional CAPM best met requirements.
An allowance for depreciation costs uses the remaining life technique of the Group Plan method. In the remaining life technique, the depreciation rate for a group of assets, such as locomotives, divides the cost of locomotives (gross investment less net salvage value) by the number of years in its whole life calculation to determine a yearly depreciation value. Any imbalances in total annual depreciation (due to early or later retirements) are adjusted over the remaining life of all the locomotives.
The whole life and remaining life of each asset are estimated by CN and CP and verified by the [Agency] through the analysis of historical data, comparisons between CN and CP, and with public data of other railway companies.
This method of calculating the depreciation ensures that the costs of employing the assets used in providing rail service can be fairly apportioned between the railway companies and shippers.
The CTA reaffirmed the choice of book values over market values of equity and assets in determining the capital structure/net rail investment in the 2017 determination. Consequently, the use of market values in determining the capital structure/net rail investment is not the focus of this consultation, nor is the cost of debt in light of the 2011 cost of capital decision and the 2017 Determination.
The cost of equity model has not been reviewed since the 2011 cost of capital decision. The 2011 cost of capital decision concluded by stating that the methodology determined would be applied by the CTA until at least 2018.
Railway companies have suggested that the current cost of capital calculated by the CTA is too low and that it leads to underinvestment, while others have suggested that the cost of capital methodology used leads to compensatory rates. Economic theory suggests that if the regulated rate of return deviates from the economically efficient optimum, incentives to investment may be distorted. Depending on whether rates are too high or too low, railway companies may overinvest or underinvest in their networks.
The CTA will re-examine its cost of equity model in light of comments made by stakeholders and the time that has elapsed since it was last reviewed.
Question 7:
Does the CTA's inclusion of a cost of capital and depreciation allowance appropriately inform the consideration of long-term investment needed in the railway companies?
Question 8:
(a) Is the cost of equity model, an input to the cost of capital methodology, currently used by the CTA appropriate for determining an adequate rate of return on investment?
(b) If it is not, which cost of equity model or combination of cost of equity models should be considered by the CTA?
Please provide a rationale for each of your responses.
Issue 5: Contribution to fixed costs
In determining the regulated interswitching rates, the CTA currently multiplies the variable costs obtained through the measurement of the interswitching activities by a factor to account for each railway company's fixed costs, that is, costs that do not depend on the volume of traffic moved. Currently, the CTA estimates this factor, called contribution to fixed costs, as the mark-up on system average variable costs required to equate them to total economic costs for the system. The reasons behind the current definition of the contribution to fixed costs are:
-
If the railway company applies the system average total cost to variable cost ratio to the variable costs of every service, then the railway company will recover its total cost, which represents all the economic resources used by the railway company in providing all its services, including interest, taxes, and a reasonable return for its shareholders.
-
The system average is thought to meet the requirement in section 112 of the Act, that the rate must be commercially fair and reasonable to all parties, in that it allows the railway companies to earn a reasonable return while protecting shippers from excessive fees.
-
As the variable costs are estimated using system average unit costs for the activities performed, the system average contribution seems to be a reasonable estimate of the contribution to fixed costs.
Few would dispute that regulated rates for railway companies must be set above marginal cost to cover fixed costs associated with providing rail service, as otherwise, railway companies would be providing service at a loss. It should be noted that marginal costs are approximated by variable costs, as the exact value of marginal costs would require the exact knowledge of railway companies' cost functions. The CTA undertook a full review of the estimation of variable costs leading to Order No. 2015-R-91.
The current method is also an approximation of Ramsey pricing, a theoretical pricing method that allows firms to set their prices above the marginal costs to cover their fixed costs.
Under the full Ramsey pricing model, while collective welfare is maximized, each shipper would have a specific markup above marginal cost that is proportional with its elasticity of demand for the traffic to be carried. In other words, some shippers would pay rates with only modest markups above marginal cost because their price sensitivity is so high that higher rates will drive them off the rail system.
Question 9:
Should the CTA continue to use the system average total to variable costs ratio as the contribution to fixed costs?
Question 10:
Could alternative approaches, such as a full Ramsey pricing model, be used to determine the contribution to fixed costs?
Question 11:
If so, how does the alternative approach meet the "commercially fair and reasonable" requirement in section 112 of the Act?
Please provide a rationale for each of your responses.
Issue 6: Productivity factors
Once the variable cost has been determined and a contribution to fixed cost applied, the CTA will apply a productivity adjustment to the costs to arrive at the regulated interswitching rates.
A productivity factor is required since the CTA's approved unit costs, which reflect the cost incurred by the railway companies to perform a unit of activity are not current to the reference year of the regulated interswitching rates.
The approved unit costs must be adjusted for changes in input prices (inflation) that the railway companies face (labour, fuel, materials) and the way the inputs are used to produce the outputs (the amount of labour used to move a gross-ton mile of traffic), which is the productivity adjustment, to provide a better estimate of costs for the year in which the CTA is calculating regulated interswitching rates.
The current productivity model used by the CTA is based on the Ideal Fisher methodologyFootnote 1 using input quantities and prices that are approximated. The underlying assumptions of the Ideal Fisher methodology are that it assumes perfect competition and constant returns to scale (no efficiency gains when the size of the railway company increases).
A suggested alternative productivity model can be found in Appendix B. This model would use actual input quantities and prices that the railway companies have recorded.
Question 12:
Is the suggested alternative for calculating railway companies' productivity preferable to the Ideal Fisher methodology?
Question 13:
Is there another productivity model that the CTA should consider?
Please provide a rationale for each of your responses.
Issue 7: Volume discount rate categories
In 1988, the CTA introduced a new category of traffic for block trains of 60 cars or more originating from or destined to a single shipper. The current regulated interswitching rates include separate car block rates for each of the four zones.
Recent railway operations now contain shipments of blocks of 170 cars or more which produce greater economies of scale than operations that only contain blocks of 60 cars. For example, the number of locomotives and crew in some cases would be the same if the train is moving 60 cars or 170 cars. Therefore, the costs (locomotives and crew) per car of the 170-car train would be less than the 60-car train.
Some stakeholders have argued that there are also cost savings to railway companies if a shipper ships groups of cars of less than 60, for example, 30 or 40. They suggest that these smaller shipment sizes require less switching in yards than movements of one to two cars.
Question 14:
Is the current block size minimum of 60 cars sufficient for recognizing the efficiencies gained from moving cars in a block?
Question 15:
Should the CTA determine rates for smaller or larger shipment sizes?
Please provide a rationale for your responses.
Issue 8: Collecting interswitching service units
Subsection 127.1(3) of the Act provides that, "In determining an interswitching rate, the [Agency] shall consider the average variable costs of all movements of traffic that are subject to the rate and the rate shall not be less than the variable costs of moving the traffic, as determined by the [Agency]."
The CTA currently ensures that the regulated interswitching rates are no less than the variable costs of moving the traffic by collecting service units of actual interswitching movements and applying those service units to CTA approved system average unit costs based on submitted financial and operating data from CN and CP.
Each year, CTA staff visits select interchanges and speaks with railway company personnel to gather information on how they serve a sample of interswitching shippers (i.e., how far the train must travel to reach a shipper, how much time is required to spot and pull at the shipper siding, etc.). Railway company personnel will estimate these service units based on their experiences of annual car volume fluctuations (given that summer months may have more car volumes and would require additional switching time, while winter months may have less car volumes and would require less switching time, railway company personnel are asked to provide average service units).
The CTA then applies the methodology set out in Determination No. R-2018-254 to calculate the regulated interswitching rates.
Question 16:
Is there another way to collect interswitching service units to accurately calculate the average variable costs of all interswitching movements, as required by subsection 127.1 (3) of the Act?
Please provide a rationale for your response.
Issue 9: Transparency of the regulated interswitching rates and methodology
As part of its Regulatory Modernization Initiative, the CTA held consultations on its suite of rail-related regulations in 2018. As part of that process, some stakeholders indicated that more transparency and information is needed on how interswitching rates are set. As well, some stakeholders indicated that small and medium-sized shippers may not be aware when the interswitching rate applies.
Determination No. R-2018-254 explained the methodology it used to set the rates. The CTA is now seeking input on what other measures it could take to make sure that the methodology is clear, and that rates are widely known.
In addition, the CTA is seeking input on how railway companies can assist in this regard. For example, the regulated interswitching rates that shippers pay are embedded in the long-haul rate and paid to the long-haul carrier. The long-haul carrier will then reimburse the local carrier for the regulated interswitching move. If there are any clerical errors in the interswitching charge (wrong zone charge or incorrect additional kilometre charge), a shipper would not be able to identify it with the current process.
Question 17:
How can the CTA make the regulated interswitching rates and/or rate setting methodology more transparent and accessible to Canadians?
Question 18:
Are there measures that railway companies can take to ensure shippers are aware of the applicable rate? For example, would it be appropriate to require railway companies to show the regulated interswitching rate, as a separate charge on the waybill? Should this charge be paid by the shipper directly to the railway company providing the interswitching service?
Appendix A – Regulated Interswitching Zones
| Zone | Zone Definition |
|---|---|
| Zone 1 | Customer siding is located wholly or partly within 6.4 km of an interchange measured along the line of track of the terminal carrier. |
| Zone 2 | Customer siding is located wholly or partly within 10 km of an interchange measured along the track of the terminal carrier and wholly outside zone 1 . |
| Zone 3 | Customer siding is located wholly or partly within 20 km of an interchange measured along the track of the terminal carrier and wholly outside zones 1 and 2. |
| Zone 4 | Customer siding is located wholly or partly within a radial distance of 30 km of an interchange and wholly outside zones 1, 2 and 3. |
Appendix B – Alternative Productivity Model
Introduction
Productivity measures are required in most CTA regulatory cost determinations, including the development of interswitching rates. This is because, for such cost determinations, the CTA uses its approved unit costs, which reflect the cost incurred by the railway companies to perform a unit of activity in a past year, and adjusts the approved unit costs to reflect the estimated costs of each railway activity in the reference year, to account for changes in both the input prices faced by the railway company (inflation) and the way the inputs are used to produce the outputs (productivity). This makes productivity measurement an important part of the activities needed to meet the CTA’s regulatory mandate.
The CTA stopped updating railway productivity indices on an annual basis starting in 2008. It currently applies annually updated inflation rates, and for the productivity adjustments, an average of past productivity rates. As a consequence, productivity rates are calculated annually to properly adjust for any cost determination.
It is important to apply a productivity measure that is adequately grounded in economic theory, and minimizes misspecification and measurement biases. The present consultation document outlines some considerations about the CTA Productivity Model set in 1997, and presents a suggested updated methodology on which stakeholders are invited to provide their comments.
The need to adjust for productivity
Variation of cost over time is caused by variations in three different factors: output; input prices; and productivity level. When the CTA brings forward to a reference-year cost levels that are measured in a past year, we take into consideration not only the inflation factors related to the change in input prices, but also the productivity growth factor (related to the changes in the quantity of inputs required for a given level of output).
For example, if hourly wages have increased by 10% between 2010 and 2012, it cannot be assumed that labour costs have increased by 10% over the same period (as the number of hours worked that are required in 2012 may be below the 2010 level because of productivity gains). If, in the meantime, the required hours worked in 2012 decreased by 10% compared to their 2010 level, it is assumed that labour costs have been constant between 2010 and 2012. When bringing forward costs that were incurred in a past year, we multiply them by an inflation factor, and also divide them by a productivity factor. This can be mathematically expressed as follows:
C1 = Ct-s(1 + p) / (1 + g)
Where Ct−s is the cost incurred in the past (s years before the current year t), Ct the estimated cost at the current year, (1 + p) the inflation factor over the period, and (1 + g) the productivity factor.
In practice, a single Total Factor Productivity value (or calculation) is used for many services and the more correctly this productivity factor is measured, the better past unit costs are adjusted.
The current Productivity Model
The last time the CTA set a method to calculate annual productivity rates was in 1997 after it held a consultation process. Following this process, on December 10, 1997, the CTA issued a final report to the parties stating that it would use a method called ”the Ideal Fisher Index” to calculate annual productivity growth rates.
The current method is based on an academic paper written by Erwin Diewert in 1992, where the Fisher Productivity Index is connected to fundamental economic assumptions. Two of these assumptions are perfect competition and constant returns to scale. The current method also uses a database in which some variables, such as the material portion of expenses, are estimated.
A new approach developed by Mr. DiewertFootnote 1 reformulates the model to calculate annual productivity growth rates by allowing imperfect competition and non-constant returns to scale, which may be a more accurate representation of the Canadian railway industry. As well, railway submitted data can be used to more precisely calculate variables used in determining productivity factors. The effect is illustrated below.
Comparative Results
| Year | Old Method Old Database (A) |
New Method Updated Database (B) |
|---|---|---|
| 1992 | 100.00 | 100.00 |
| 1993 | 106.66 | 109.76 |
| 1994 | 119.10 | 119.61 |
| 1995 | 117.22 | 108.37 |
| 1996 | 120.43 | 120.69 |
| 1997 | 131.60 | 127.95 |
| 1998 | 133.84 | 125.86 |
| 1999 | 141.13 | 135.92 |
| 2000 | 153.15 | 154.48 |
| 2001 | 156.46 | 154.99 |
| 2002 | 161.82 | 157.13 |
| 2003 | 169.64 | 168.42 |
| 2004 | 181.84 | 175.85 |
| 2005 | 180.19 | 176.87 |
| 2006 | 184.71 | 184.35 |
| 2007 | 177.58 | 191.60 |
| 2008 | 169.20 | 177.56 |
| 2009 | 160.56 | 181.22 |
| 2010 | - | 202.61 |
| 2011 | - | 189.24 |
| 2012 | - | 196.47 |
A model that assumes perfect competition and constant return to scale was used to calculate Column (A), whereas a model that assumes imperfect competition and non-constant returns to scale was used to calculate column (B).
The impact of each method on regulated rates is illustrated below, based on an analysis using a hypothetical case with the following assumptions:
| Year | Old Method Old Database (A) |
New Method Updated Database (B) |
Price Index (C) |
|---|---|---|---|
| 2005 | 180.193 | 176.865 | 100.00 |
| 2006 | 184.710 | 184.353 | 102.00 |
| 2009 | 160.564 | 181.219 | 110.00 |
In this hypothetical case, the last known unit costs were in 2005. A regulated inter-switching rate per car is calculated in two different scenarios: a projected rate 2006 and another one in 2009. We assume that, based on 2005 unit costs, the regulated rate would have been $50 per car. We then have the following projected rates corresponding to each method:
| Estimation Period |
Old Method Old Database (A) |
New Method Updated Database (B) |
Inflation Only (C) |
|---|---|---|---|
| 2005-2009 | 61.724 | 53.679 | 55.00 |
| 2005-2006 | 49.753 | 48.929 | 51.00 |
The rates were projected by multiplying the base year rate by the corresponding inflation factor and dividing by the related productivity factor. For instance, the projected rate for column (B) over the period 2005-2009 was obtained the following way: $53.679 = $50(110/100)/(181.219/176.875)
When the updated database is applied to the old method, the new method does not systematically project a lower or a higher rate. In one case, the old Fisher method provides a higher rate and, in the other period of analysis, the new method produces a higher rate.
A more detailed technical report on this productivity model is available upon request.
- Date modified: