Inquiry Report - 2019 Vancouver Freight Rail Investigation (Revised)
Table of contents
Revised February 6, 2019
Case No. 19-00189
Introduction
On January 14, 2019, the Canadian Transportation Agency (Agency) initiated an investigation into possible freight rail service issues in the Vancouver area, pursuant to subsection 116 (1.11) of the Canada Transportation Act, S.C. 1996, c. 10, as amended (CTA). Consistent with the requirements of the CTA, the Minister of Transport provided his authorization of the investigation.
The decision to launch the investigation followed receipt of communications and information from shipper organizations and other interested parties regarding current, perceived freight rail service issues in and around the Vancouver area. The matters covered by the Agency’s investigation include whether there is evidence of discriminatory treatment of certain commodities; how freight rail permits and/or embargoes are being used; and whether railway companies operating in the Vancouver area are fulfilling their service obligations. For the purposes of the investigation, the Agency appointed an Inquiry Officer, pursuant to subsection 38(1) of the CTA, and instructed her to: (1) conduct interviews and take written statements from individuals and organizations involved in, or affected by, the alleged freight rail service issues; (2) obtain any documents, records and information relevant to the inquiry; and (3) submit a summary report to the Agency no later than January 23, 2019.
This Inquiry Report summarizes the information and data gathered by the Inquiry Officer in the period from January 14, 2019, to January 22, 2019. It represents only one component of the Agency’s fact-finding process and does not reach any conclusions. Input received has been aggregated or summarized, so that no confidential information is contained in this Inquiry Report.
Overall, information and data received by the Inquiry Officer can be divided into five main themes, all of which may be relevant in assessing whether a railway company has fulfilled its service obligations.
These themes are as follows:
- Differential treatment of certain commodities;
- The imposition of embargoes and/or permits;
- Railway company operational issues;
- Infrastructure; and,
- Quality of communications .
Participants and Process
On January 14, 2019, the Agency issued letter decisions to the Canadian National Railway Company (CN), Canadian Pacific Railway Company (CP), BNSF Railway Company (BNSF), the Forest Products Association of Canada (FPAC), Western Grain Elevator Association (WGEA), the Canadian Oilseed Processors Association (COPA), the Freight Management Association of Canada (FMA), and the Western Canadian Shippers’ Coalition (WCSC) (collectively, the participants).
In those decisions, the Agency directed each participant to submit specific information and data related to its operations in order to provide the Agency with information required for the investigation (please refer to Annex A).
The railway companies (CN, CP and BNSF) endeavoured to provide the information and data requested by the Agency and responded to additional requests for clarification. Shipper associations (FPAC, WGEA, COPA, FMA and WCSC) provided input and data to the process, to varying degrees, which affected the scope of the Inquiry Report.
As part of the investigation, to supplement the data and information provided, the Inquiry Officer held teleconferences with stakeholders who expressed interest in providing input, notably representatives from certain Terminals operating in and around Vancouver, and the Port of Vancouver.
Themes
1. Differential Treatment of Certain Commodities
1.1 Issue
Some shipper associations have indicated that railway companies are moving certain commodities in preference to others. They suggest that this practice contravenes railways’ service obligations.
1.2 Railway Companies
The tables below are summarized from railway company-supplied Waybill data. The data were adjusted to ensure comparability for containerized loads and other commodities.
| Commodity | 2015 | 2016 | 2017 | 2018 |
|---|---|---|---|---|
| Containerized Loads | 82,437 | 77,579 | 93,803 | 98,829 |
| Coal | 19,166 | 21,926 | 18,926 | 19,338 |
| Grains | 42,519 | 47,662 | 49,994 | 52,290 |
| Chemicals | 31,435 | 35,363 | 31,783 | 39,379 |
| Forest Products | 19,896 | 20,632 | 18,031 | 17,674 |
| Other | 58,554 | 66,687 | 57,420 | 64,243 |
| Totals | 254,007 | 269,849 | 269,957 | 291,753 |
| Commodity | 2015 | 2016 | 2017 | 2018 |
|---|---|---|---|---|
| Containerized Loads | 36,204 | 36,305 | 37,881 | 42,740 |
| Coal | 53,030 | 55,859 | 55,849 | 58,550 |
| Grains | 35,807 | 37,446 | 45,536 | 49,764 |
| Chemicals | 17,866 | 19,530 | 20,412 | 24,567 |
| Forest Products | 4,069 | 4,101 | 4,678 | 3,962 |
| Other | 27,708 | 32,014 | 25,632 | 27,904 |
| Totals | 174,683 | 185,255 | 189,988 | 207,487 |
| Commodity | 2016 | 2017 | 2018 |
|---|---|---|---|
| Coal | 10,380 | 16,495 | 17,337 |
| Grains | 2,489 | 1,641 | 2,015 |
| Chemicals | 7,245 | 7,494 | 9,838 |
| Forestry Products | 2,651 | 2,070 | 2,211 |
| Construction | 4,047 | 3,937 | 4,215 |
| Other | 1,887 | 3,554 | 2,692 |
| Totals | 28,699 | 35,191 | 38,308 |
It should be noted that in some circumstances (interswitching, exchange switching, or other commercial arrangements) cars will be handled by two of the companies. This does not result in double counting since the car will be processed by each carrier, and therefore adds to workloads for both carriers.
1.3 Shipper Associations
Overall, concerns were raised regarding shippers experiencing longer than usual dwell times (mostly at origin) and service delays resulting in their inability to ship their products to market in a timely fashion (which has resulted in the corresponding incurrence of additional costs in the form of contract penalties, demurrage, etc.) Further, shipper associations indicated that the railway companies are not delivering the number of rail cars ordered, or are only moving certain commodities destined to certain locations on specific days.
No empirical data were provided by any shipper associations with the exception of agriculture. The charts below depict the number of hopper cars supplied to WGEA member companies and the number of cars ordered over the reference period.
| Month | 2015-16 | 2016-17 | 2017-18 | 2018-19 |
|---|---|---|---|---|
| October | 9,249 | 8,532 | 8,781 | 12,310 |
| November | 7,537 | 11,487 | 10,783 | 10,109 |
| December | 9,945 | 7,632 | 7,588 | 7,449 |
| Crop year total | 26,731 | 27,651 | 27,152 | 29,868 |
| Month | 2015-16 | 2016-17 | 2017-18 | 2018-19 |
|---|---|---|---|---|
| October | 10,321 | 12,113 | 12,678 | 15,617 |
| November | 11,211 | 13,401 | 11,280 | 12,166 |
| December | 12,256 | 9,768 | 10,726 | 10,251 |
| Crop Year total | 33,788 | 35,282 | 34,684 | 38,034 |
According to information and data provided by the WGEA, in Tables 4 and 5, the data show cumulative cars supplied by CN and CP to all WGEA member companies in 2018-19 are 9.8 percent higher than during the 2017-18 grain year, representing an incremental 6,066 hopper cars. The increase in car supply is comparable for both railway companies (CN - 10%, CP- 9.7%).
| Month | 2015-16 | 2016-17 | 2017-18 | 2018-19 |
|---|---|---|---|---|
| October | 9,876 | 9,101 | 10,208 | 12,561 |
| November | 8,063 | 12,138 | 13,148 | 10,370 |
| December | 10,009 | 8,478 | 8,048 | 8,463 |
| Totals | 27,948 | 29,717 | 31,404 | 31,394 |
| Month | 2015-16 | 2016-17 | 2017-18 | 2018-19 |
|---|---|---|---|---|
| October | 10,289 | 11,876 | 12,954 | 15,215 |
| November | 11,429 | 14,104 | 11,921 | 13,319 |
| December | 12,216 | 9,223 | 10,799 | 10,362 |
| Totals | 33,934 | 35,203 | 35,674 | 38,896 |
On the demand-side, upon examination of hopper car orders placed, WGEA-supplied data show, in Tables 6 and 7, demand (orders) has increased 4.7 percent (3,212 cars) comprised of a 9 percent increase for CP and no change in demand for CN. The difference in the number of cars supplied by CN this year versus last (+2,716), despite no increase in demand by WGEA member companies, reflects an increase in CN’s order fulfillment this year for the October – December timeframe (fulfilling 95 percent of shipper orders this year versus 86 percent of orders last year.)
No other shipper association provided empirical evidence respecting supply chain fluidity.
1.4 Others
No other participant submitted evidence on this issue.
2. The Imposition of Embargoes and/or Permits
2.1 Issue
Some shipper associations have raised concerns regarding the imposition of embargoesFootnote 1 and the issuance of permitsFootnote 2 by railway companies, for traffic destined to the Port of Vancouver.
Allegations have been made that some railway companies are deploying embargoes and issuing permits "more often than normal," harming some commodity sellers more than others in an effort to push through the maximum overall volume. In fact, some shipper associations have suggested that this is a seasonally recurring practice and aimed at the forest products sector, in particular, impacting the timely movement of their traffic through the Port for furtherance to markets. They indicate that the permits are frequent and of lengthy duration an
d suggest they are being used inappropriately to manage operational railway company issues. Railway companies have indicated that the imposition of an embargo and permit system is one mechanism used to reduce rail car congestion in a specific area, in order to allow for a smoother and more efficient rail transportation system.
2.2 Railway Companies
The investigation looked at the number of embargoes imposed and permits issued by the three railway companies over the reference period, October-January (2015-2019), including to who, to what, and to where they were applied.
| Railway Company | Oct. 2015 – Jan. 2016 | Oct. 2016 – Jan. 2017 | Oct. 2017 – Jan. 2018 | Oct. 2018 – Jan. 2019 | Total |
|---|---|---|---|---|---|
| CN | 2 | 1 | 8 | 12 | 23 |
| CP | 0 | 0 | 0 | 3 | 3 |
| BNSF | 0 | 0 | 1 | 0 | 1 |
| Total | 2 | 1 | 9 | 15 | 27 |
| Oct. 2015 – Jan. 2016 | Oct. 2016 – Jan. 2017 | Oct. 2017 – Jan. 2018 | Oct. 2018 – Jan. 2019 | |
|---|---|---|---|---|
| Canadian National RailwayFootnote 3 | N/A | N/A | 9,287 | 14,314 |
| Canadian Pacific Railway | N/A | N/A | N/A | 993 |
| Oct. 2015 – Jan. 2016 | Oct. 2016 – Jan. 2017 | Oct. 2017 – Jan. 2018 | Oct. 2018 – Jan. 2019 | |
|---|---|---|---|---|
| Canadian National RailwayFootnote 4 | N /A | N/A | 82% | 73% |
| Canadian Pacific Railway | N /A | N/A | N/A | 100% |
Note: For Tables 9 and 10, N/A = data not available
CN issued two embargoes in 2015 and one in 2016 impacting traffic destined to the Port of Vancouver. In 2017, CN imposed eight embargoes, mostly impacting facilities on Vancouver’s North Shore, and covering various commodities. CN indicated that the embargoes were imposed largely to deal with congestion issues. CP did not impose any embargoes impacting traffic heading to the Port of Vancouver during the 2017 reference period.
For 2018, during the reference period, CN imposed eleven embargoes, one of which is ongoing, and which CN indicated was issued due to congestion for all terminals requiring an interchange with BNSF and CP at the New Westminster interchange.
On December 12, 2018, CP issued an embargo which, according to their notice to customers, was to assist CN in expediting their recovery of the congested areas and impacted the following commodities: canola, canola meal, flaxseed, special crops and pulp products. This embargo did not provide permits, which meant traffic did not move until the embargo was lifted on December 19, 2018. On December 19, 2018, CP began distributing permits for the customers that were impacted.
On December 21, 2018, CP issued a notice indicating that effective December 24, 2018, because of congestion in Vancouver, it would be issuing an embargo application for a specific logistics terminal, in an effort to "proactively manage the traffic into this congested area." According to CP, this congestion was caused by customers redirecting traffic off of CN lines to CP lines due to CN service issues.
BNSF submitted that it only issued one embargo during the specified months in 2015-2019. A search of the Association of American Railroads (AAR) Embargo SystemFootnote 5 website confirms this statement.
CN provided all requested information for the October 2015 to January 2019 (partial month) period, and all comparisons are based on three month totals (October to December). Overall CN volumes in the Lower Mainland have increased 15 percent since the 2015-2016 period, with volumes increasing in each year since 2015. By commodity, volumes of grain, container traffic, chemicals and construction materials all increased by over 15 percent in the reference period, while coal volumes remained flat and forest products declined by 11 percent (2,200 cars).
For the period October to December 2018, regulated interswitching traffic (excluding embargoed terminals) received by CN from CP and BNSF at various Vancouver interchanges decreased by 2 percent compared to the period October to December of 2017. Regulated interswitching traffic for embargoed traffic increased by 2 percent over the same period.
In 2018, regulated interswitching traffic (excluding embargoed terminals) received by CN from CP and BNSF at various Vancouver interchanges increased from October to November by 12 percent and decreased by 14 percent from November to December. Regulated interswitching traffic for embargoed traffic increased by 7 percent and decreased by 24 percent respectively.
CP provided data for the period from October 2015 to January 2019 (partial month) and all comparisons are based on 3 month totals (October to December). Overall, CP volumes in the Lower Mainland have increased by 19 percent since 2015 to January 2016 base. Volumes increased by 3 percent in 2017, and 10 percent in 2018 on a year-over-year basis.
By commodity, the analysis shows increases in volumes for container movements, grains and chemicals, with forestry and auto parts movement experiencing declines.
While CP’s forest products carloads have declined by 15 percent for the October to December 2018 versus 2017 periods, the overall change since 2015 represents a 3 percent decline.
BNSF volumes were provided for October 2016 to November 2018, and all comparisons are based on the October to November, 2 month total. Overall BNSF volumes in the Lower Mainland have increased considerably since 2016. Volumes increased by over 25 percent in 2017, and by a further 9 percent in October and November 2018 on a year-over-year basis.
From a commodity perspective, BNSF’s volumes in the Lower Mainland are dominated by coal, and to a lesser degree, chemicals, with forestry products and grain having volumes below 10 percent of total carloads.
For BNSF, from 2016 to 2017, there was a decrease in carloads for the grain and forestry sectors, as follows: grain carloads fell by 633 carloads (15%); and, forestry carloads fell by 906 cars (17%).
2018 volumes indicate a rebound, with the October and November volumes increasing 23 percent for grain and 7 percent for forestry. Because BNSF could not provide data on the December 2018 and January 2019 volumes, it is difficult to assess the impacts of recent embargoes.
2.3 Shipper Associations
Shipper associations suggested that the embargo and permit system is a traffic control mechanism intended to be used only under exceptional circumstances. However, with the exception of the agriculture sector, the evidence from shippers has been only qualitative. The greatest number of concerns expressed regarding the imposition of embargoes and permits have come from the forest products sector and have been directed to CN practices.
2.4 Others
Other relevant stakeholders (neither railway company or shipper) have indicated that they are aware of the imposition of embargoes and associated permits by the railway companies at certain times over the past two years, but have told the Agency that their understanding (which they maintain is largely anecdotally-based), is that rail transportation service has been better this fall 2018/early 2019 period than similar periods in past years.
3. Railway Operational Issues
3.1 Issue
Shipper associations have suggested that possible rail freight service issues in Vancouver are the result of inadequate staffing of crews, insufficient locomotive power for train operations, poor planning to meet demand, and car shipment practices (e.g. block shipments).
3.2 Railway Companies
CP submitted no specific data on operational issues, but indicated that during the period of November to December 2018 and to present, and during the period October 2017 to January 2018, CP did not have to redirect any locomotives to service the Vancouver area as none, in their view, was needed to alleviate the alleged congestion. Similarly, CP indicated that it did not face any equipment shortage in the Vancouver area during the calendar years 2017 and 2018. CP states its network was properly resourced with its existing locomotive units at all times.
In respect of labour, CP indicated that during the period of November to December 2018 and to present, and during the period October 2017 to January 2018, CP did not redirect any crews to service the Vancouver area as none, according to the railway company, was needed to alleviate the alleged congestion. CP further stated that it did not face any labour shortage in the Vancouver area during the calendar years 2017 and 2018. The railway company states its network was properly resourced with its existing local crews at all times.
CN provided the following CN-specific information:
Locomotives: Table 11 depicts the change in the number of locomotives in Vancouver, in working order, at midnight on average by month (excluded are locomotives deemed "in bad order status"). The information is sourced from CN’s midnight locomotive inventory snapshot, which records the location of every locomotive on the CN system once a day.
| Year / Month | Jan. | Feb. | Mar. | April | May | June | July | Aug. | Sept. | Oct. | Nov. | Dec. |
|---|---|---|---|---|---|---|---|---|---|---|---|---|
| 2017 | N/A | 11% | -2% | -13% | 2% | -2% | 4% | 0% | -4% | -13% | 9% | 14% |
| 2018 | -11% | -10% | 9% | 4% | -10% | -4% | 4% | 11% | 2% | 2% | 15% | 3% |
Crews: Table 12 presents the percentage change in the number of qualified, unionized running trades CN employees deployed in Vancouver, based on a snapshot taken on the 15th days of each month. This includes CN employees based in Vancouver and other CN employees brought in from other locations.
| Year / Month | Jan. | Feb. | Mar. | April | May | June | July | Aug. | Sept. | Oct. | Nov. | Dec. |
|---|---|---|---|---|---|---|---|---|---|---|---|---|
| 2017 | N/A | 0% | 2% | 1% | -3% | -6% | 6% | -1% | 2% | 0% | -2% | -3% |
| 2018 | 7% | 2% | -2% | 10% | -3% | 1% | -1% | 0% | -1% | 2% | -2% | 9% |
Table 13, below, provides information on the unloading capacity of terminals impacted by recent and past railway company embargoes. The railway companies maintain more rail cars are being delivered than these terminals can support in a given day and therefore, an embargo is issued to avoid exacerbating the unloading back-log.
| Terminal | Unloading Capacity (cars per day) |
|---|---|
| Coast 2000 Terminals Ltd. | 30 |
| Euro Asia Inc. | 44 |
| Lynnterm Terminal | 54 |
| Olympia Transportation Ltd. | 23 |
| Portside | 10 |
| Squamish Terminals | 18 |
| Westran Services | 10 |
3.3 Shipper Associations
No empirical evidence was provided by shipper associations on this issue.
With respect to the agriculture sector, the evidence indicates that railway operations in respect of rail car/train management has resulted, at times, in certain problems for this sector.
For instance, the majority of grain shipped from, in this case, CN stations is shipped in unit trains of 100 car blocks, but railway company practice is to routinely move railcar train units in excess of 170 cars to optimize efficiency. The evidence shows the consequences of this practice is to "break up" portions of built trains received at a point of origin, thereby leaving components of shipments at various places along the route, with shipments arriving to Port out of sequence, grain grades and quality blends arriving in the wrong order, and the terminal facility forced to hold product and vessels while waiting for the rest of the original rail cars to arrive.
3.4 Others
There was no evidence submitted by other participants in respect of this issue.
4. Infrastructure
4.1 Issue
Some shipper associations have suggested that infrastructure bottlenecks in the Vancouver area have contributed to what they see as possible challenges to the efficiency of the transportation supply chain, of which rail service represents a major component.
4.2 Railway Companies
In 2006, CN and CP signed a co-production agreement to increase fluidity in and around the Port of Vancouver.
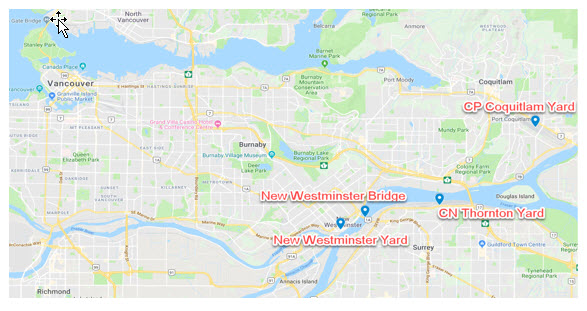
The co-production agreement (please refer to Annex B) allows CN and CP to trade trains at Boston Bar approximately 125 miles east of Vancouver and crew these trains to customers in the Burrard Inlet via the most direct route (CN route to the north shore and CP route to the south shore) while bypassing the interchange at Sapperton, New Westminster and Vancouver.
According to the railway companies, the co-production agreement has improved flow into Vancouver while maintaining balance in terms of volume over the New Westminster bridge (owned by the Government of Canada) which consists of a single track which is used by CN, CP, BNSF, the Southern Railway of British Columbia railway, Amtrak and VIA rail. The New Westminster bridge is a swing bridge which rotates into an open position for up to 8 hours per day for marine vessels if required. Each
day, railway companies will coordinate access to the bridge to maximize throughput. Trains are dispatched based on their release or need at the terminal with consideration of the availability of space to receive the train. As the trains approach the bridge, the train crew will request for a signal to pass the bridge. Passenger trains are given priority at the bridge. For freight trains, authorization is typically issued on a first come-first served basis to maximize the number of trains over the bridge.
To further alleviate the congestion of the New Westminster bridge, all interswitching traffic from BNSF to CN is brought directly into CN’s Thornton yard instead of crossing the New Westminster bridge and transferring the cars to CN at New Westminster yard. Railway companies have suggested that the New Westminster interchange can become particularly congested.
4.3 Shipper Associations
Some shipper associations informed the Agency that their respective operations were near the point of having to cease production in early December 2018 due to rail service challenges in the Vancouver corridor. Congestion at or around the New Westminster interchange (where rail cars are interswitched with BNSF) was identified by many shippers as just one example of a "bottleneck," albeit a significant one, in the transportation supply chain.
4.4 Others
Other stakeholders have suggested, (without providing supporting evidence), a possible expansion of the Port of Vancouver as a path forward to accommodate additional rail traffic and commodity volumes.
Suggestions have also been put forward to redirect rail traffic to other areas to alleviate potential challenges posed by traffic congestion around the Port.
Significant federal investment funding has been announced within the last several months for projects aimed at improving railway company infrastructure (e.g. railway company sidings, terminals, better north to south shore connections, etc.) in the Port of Vancouver. It has been acknowledged, however, that significantly more investment is still required to fund projects connecting mainline transportation infrastructure to terminals, the so called "last mile."
5. Quality of Communications
5.1 Issue
Shipper associations have raised concerns regarding poor communication by railway companies concerning changes in service or service disruptions, as well as a lack of information transparency, and asymmetric information.
5.2 Railway Companies
The Agency did not direct the railway companies to provide information regarding this area, nor have the railway companies volunteered to provide it.
5.3 Shipper Associations
The only information received by shipper associations regarding this issue was anecdotal. Some shipper associations told the Agency about communication shortfalls between themselves and the railway companies, particularly CN. They maintain the current alleged rail service issues in Vancouver are recurrent, and embargoes and permits have been imposed without advance notice, which according to some shippers, signals a lack of proper operational planning by the railway companies.
Some shippers also raised concerns about not being provided with any information on when an embargo imposed by a railway company would be lifted and when regular service could resume. They have maintained the lack of information has created an environment of uncertainly and is negatively impacting their respective businesses, including the ability to honour contracts with buyers (domestic and international).
5.4 Others
No evidence was submitted by other participants on this issue.
List of Annexes
- Specific Information/data sought from CN, CP, BNSF and Shipper Associations
- Information on CN CP Co-Production Agreement
Annex A -Information / Data Required from Participants
Information / Data Required from Canadian National (CN) and Canadian Pacific (CP) Railway Companies
The Agency directed CN and CP to provide any information and data in its possession that is relevant to the issues identified, including but not limited to the following:
- Waybill level data indicating shipper origins and destination for all movements in and out of Vancouver in the months of October-January in years 2015-2019. The specific data required are the following:
- Origin by Standard Point Location Code (SPLC) and Freight Station Accounting Code (FSAC)
- Origin railway
- Departure date and time
- Unique shipment identifier
- Train ID
- Shipper name
- Interchange SPLC
- Interchange railway
- Destination railway
- Destination by SPLC and FSAC
- Destination date and time
- Number of cars
- Commodity by Standard Transportation Commodity Codes (STCC)
- Train segment/shipment data in the months of October-January in years 2015-2019:
- Unique shipment identifier
- Train type
- Origin by SPLC and FSAC
- Destination by SPLC and FSAC
- Miles
- Details for all permits issued, requested, and denied in the months of October-January in years 2015-2019. This should include the purpose of the permit action, the date of the request and approval or denial, and the name and location of the shipper, railways, and the port facility or interchange affected by the permit.
- Interswitching data for the period of October 2018 to January 2019 (as submitted annually) for movements over the Interchanges in the Lower Mainland of British Columbia (Vancouver, New Westminster, etc.).
- Details of any traffic rerouted around the Vancouver corridor due to impacts of permits issued and embargoes imposed between October 2018 and January 2019.
Information / Data Required from BNSF Railway
The Agency directed BNSF to provide any information and data in its possession that is relevant to the issues identified, including but not limited to the following:
- Waybill level data indicating shipper origins and destination for all movements in and out of Vancouver in the months of October-January in years 2015-2019. The specific data required are the following:
- Origin by Standard Point Location Code (SPLC) and Freight Station Accounting Code (FSAC)
- Origin railway
- Departure date and time
- Unique shipper identifier
- Train ID
- Shipper name
- Interchange SPLC
- Interchange railway
- Destination railway
- Destination by SPLC and FSAC
- Destination date and time
- Number of cars
- Commodity by Standard Transportation Commodity Codes (STCC)
- Details for all permits issued, requested, and denied in the months of October-January in years 2015-2019. This should include the purpose of the permit action, the date of the request and approval or denial, and the name and location of the shipper, railways, and the port facility or interchange affected by the permit.
- Details of any traffic rerouted around the Vancouver corridor due to impacts of permits issued and embargoes imposed between October 2018 and January 2019.
Information / Data Required from Shipper Associations
The Agency directed the named shipper associations to provide any information and data in its possession that is relevant to the issues identified, including but not limited to the following:
- Total car supply received at origin in the months of October to January in years 2015-2019.
- Total number of train deliveries per week and the total number of cars on each train delivered at Terminals in Vancouver.
- Any information on requests, denials and approvals for permits, including the location of the shipper, origin and destination, railway(s) and interchange(s) used.
- The number of carloads affected by the denial of permits for the months of October to January, in years 2015-2019.
- Total siding length (Vancouver terminals).
- Any evidence of additional costs (trucking bills, administration costs) incurred due to the embargo and permit system deployed by the railways.
- Any evidence of the imposition of discriminatory measures or practices on the part of service providers operating in the area.
Annex B: Information on CN CP Co-Production Agreement
In 1999 CN and CP signed a directional running rights agreement which allows all CN and CP traffic to travel west over CN and east over CP's track for approximately 156 miles between a point 57 miles west of Kamloops and Mission, and a point approximately 25 miles east of CN’s Thornton Yard and CP’s Coquitlam Yard.
CP line-haul traffic (CP traffic on a CP train, delivered to destination by CP) travelling west into Vancouver crosses the Mission bridge back onto the CP network (north of the Fraser River) to CP’s Coquitlam yard.
CN line-haul traffic travelling west into Vancouver continues on CN's track (south of the Fraser River) to CN’s Thornton yard.
On the eastbound move CP line-haul traffic stays on CP track eastbound while CN line-haul traffic crosses the Mission bridge onto the CP network (north of the Fraser River) to move east.
In 2006, CN and CP signed a co-production agreement to increase fluidity in and around the Port of Vancouver.
The co-production agreement allows CN and CP to trade trains at Boston Bar approximately 125 east of Vancouver and crew these trains to customers in the Burrard Inlet via the most direct route (CN route to the north shore and CP route to the south shore) while bypassing the interchange at Sapperton, New Westminster and Vancouver.
The train exchange is done on a one for one basis so there is no net increase in volume over either railway’s corridor, including the New Westminster rail bridge on CN.
CP Interswitching traffic not exchanged at Boston Bar travels on CN's network westward to Mission and then crosses over the Mission bridge and moves west to CP Coquitlam yard. A separate train will then move the interswitching traffic east on the CP line to the mission bridge, crosses the mission bridge to CN track and them moves west to CN’s Thornton yard. This traffic will return to CP by reversing this route.
According to the railways, the co-production agreement has improved flow into Vancouver while maintaining balance in terms of volume over the New Westminster bridge (owned by the Government of Canada) which consists of a single track which is used by CN, CP, BNSF, the Southern Railway of British Columbia railway, Amtrak and VIA rail. The New Westminster bridge is a swing bridge which rotates into an open position for up to eight hours per day for marine vessels if required.
To further alleviate the congestion of the New Westminster bridge, all interswitching traffic from BNSF to CN is brought directly into CN's Thornton yard instead of crossing the New Westminster bridge and transferring the cars to CN at New Westminster yard.
- Date modified: