Second Inquiry Report - 2019 Vancouver Freight Rail Investigation
Table of contents
March 6, 2019
Case No. 19-00189
Background
On January 14, 2019, the Canadian Transportation Agency (Agency) initiated an investigation into possible freight rail service issues in the Vancouver area, pursuant to subsection 116 (1.11) of the Canada Transportation Act, S.C. 1996, c. 10, as amended (CTA). Consistent with the requirements of the CTA, the Minister of Transport provided his authorization of the investigation.
The decision to launch the investigation followed receipt of communications and information from shipper organizations and other interested parties regarding what some perceived as freight rail service issues in and around the Vancouver area. The matters covered by the Agency’s investigation include: whether there was evidence of discriminatory treatment of certain commodities; how freight rail permits and/or embargoes were being used; and whether railway companies operating in the Vancouver area were fulfilling their service obligations.
For the purposes of the investigation, the Agency appointed an Inquiry Officer, pursuant to subsection 38(1) of the CTA, and instructed her to:
- conduct interviews and take written statements from individuals and organizations involved in, or affected by, the alleged freight rail service issues;
- obtain any documents, records and information relevant to the inquiry; and
- submit a summary report to the Agency on January 23, 2019.
The January 23, 2019 report (lnquiry Report - 2019 Vancouver Freight Rail Investigation) summarized the information and data gathered by the Inquiry Officer in the period from January 14, 2019 to January 22, 2019. A revised report was issued on February 6, 2019 to correct mathematical errors contained within Tables 1, 2, and 10 of the January 23, 2019 report.
On January 29 and 30, 2019, the Agency held an oral hearing in Vancouver as part of its investigation and heard from key participantsFootnote 1 who provided their comments on the first Inquiry Report, responded to questions posed to them by the Agency, and provided supplemental information they considered relevant.
The first Inquiry Report and the oral hearing were part of the information-gathering phase of the investigation. The Agency indicated at the conclusion of the oral hearing on January 30, 2019, that the information-gathering phase would continue for a short additional period to allow participants that committed to provide the Agency with additional information and responses to its questions during the hearing to do so. Also, the Inquiry Officer continued, during this short additional period, to request documents, records, and information she considered relevant to the matter investigated. Among others, the Inquiry Officer contacted officials of the United States (U.S.) Surface Transportation Board (STB), port terminals and facilities operators operating in the Vancouver area, and members of industry associations that did not participate in the initial phases of the investigation.
This Second Report of the Inquiry Officer concludes the information-gathering phase of the investigation. It contains information and data that can be divided into three main themes, all of which may be relevant in assessing whether a railway company has fulfilled its service obligations. These themes are as follows:
- Operations at CN's Thornton Railway Yard;
- Port terminal capacity; and,
- The imposition of embargoes and permits.
The intent of this second report is not to reach any conclusions, but to present a synopsis of the information gleaned from the oral hearing and the subsequent evidence gathering that briefly continued following the hearing. As well, all input received has been aggregated or summarized to protect confidential information.
1. Operations at CN's Thornton Railway Yard
During the oral hearing, many participants indicated there were challenges related to freight rail congestion in the Vancouver Port area during the period under investigation, stating in particular that more rail cars were moved to Thornton Yard than could be efficiently processed, leading to yard congestion. It was also stated by multiple participants that this congestion was reflected in an increase in carload cycle times and dwell time in CN's Thornton Yard.
Accordingly, the Inquiry Officer gathered information to assess whether there had been changes in car volumes arriving into Thornton Yard in October and November 2018, as compared to the same period in 2017. The data received indicates the following:
- 16% increase in intermodal platform cars;
- 18% increase of cars destined to be interchanged with BNSF in Vancouver;
- 11% increase in grain cars destined to the North Shore in Vancouver; and,
- 16% increase in wood pulp cars destined to the North Shore in Vancouver.
The data also show there was an increase in other traffic, including arrivals of traffic for interchange at Thornton and/or destined to North Shore customers. (Section 2 of this Report provides more information on port terminal capacity during the period under review.)
CN data for "cars on hand" in Thornton Yard show an increase in the number of cars dwelling in Thornton Yard that were destined to the North Shore. There were just over 300 cars in Thornton Yard destined to North Shore customers on October 1, 2018 compared to 1,171 cars on December 13, 2018, the date the data show the number of North Shore cars on hand peaked. This represents a 279 percent increase between October 1, 2018 and December 13, 2018. Further detail on the North Shore is provided below.
Vancouver North Shore
North Vancouver is home to some of this country's largest terminal operations and a number of smaller terminals and rail shippers, all of which are served by CN at their facilities.
Traffic bound for the North Shore of Vancouver can originate virtually anywhere in Canada and, according to the Railway Association of Canada (RAC) Canadian Rail Atlas, can be moved to destination either south, through the Fraser Canyon by way of Kamloops and the lower mainland or, if appropriate, via a route west from Edmonton through Tête Jaune Cache, northwest to Prince George, and then south from Prince George into North Vancouver via Quesnel, 100 Mile House, Pemberton and Squamish.
The vast majority of traffic moves via the Kamloops route, which is a more direct routing for most traffic, and one of the busier parts of CN's network into Vancouver.
CN traffic moving into the lower mainland via the Fraser Canyon will arrive via CN's main yard facility, Thornton Yard, in Surrey (British Columbia). The exceptions are traffic destined to Roberts Bank and unit trains to the North Shore, both of which typically bypass Thornton Yard.
Like CP's Coquitlam Yard, CN's Thornton Yard is a major staging area for operations in the lower mainland. It is CN's coordinating point for virtually all traffic in and out of the port terminals and surrounding area.
Manifest train traffic (i.e., trains comprising different types of rail cars carrying different types of freight for multiple shippers) from Thornton is directed into the various industrial areas (North Shore, South Shore, Fraser Surrey, New Westminster, Richmond, and Delta) in smaller car blocks, which according to some participants, requires yard switching activities in and around Thornton Yard. For example, manifest traffic to the North Shore travels predominantly via the Fraser Canyon into Thornton Yard, where it is switched onto a transfer train for movement to the North Shore. Manifest traffic is then transferred to CN's North Vancouver servicing yard, Lynn Creek Yard, where the traffic is sorted and delivered to North Shore customers. Grain traffic to the North Shore is usually treated similarly in the delivery process; it is transferred to Lynn Creek and switched into the grain facilities via local crews in North Vancouver.
Some participants suggested that while similar procedures are used for deliveries to the other operating regions, the volumes and capacity issues surrounding the North Shore make it stand out in terms of complexity. It was also suggested that when Thornton Yard becomes congested, the impact is likely to be disproportionately felt in manifest traffic which requires local switching resources (i.e., locomotives, crew and yard capacity) prior to delivery.
CN has noted that as an additional step to address congestion in late 2018, it decided to assemble trains further out into its network, such as at Kamloops. CN indicated that this action was aimed at reducing the burden on infrastructure and crews in the Vancouver area.
CN Inbound (to Thornton Yard) Car Data
Following the oral hearing, the Inquiry Officer requested that CN provide data on car arrivals at Thornton Rail Yard. These data were sought in order to gain a better understanding of yard capacity and the number, types of trains, and volumes of traffic moving into the yard within the periods of October 2017 to January 2018, and October 2018 to January 2019. Note that data for intermodal units are characterized as per "platform", since "platforms" are the rough equivalent of a rail car in the context of yard capacity. The data indicate the following:
- The largest shares of inbound cars (platforms) received at Thornton related to intermodal and interchange activities during the period between October 2017 to January 2018 and October 2018 to January 2019.
- Intermodal platforms accounted for 20 percent of total inbound traffic in the October 2018 to January 2019 period, compared to 16 percent in the October 2017 to January 2018 period.
- Intermodal traffic grew 32 percent year-over-year (i.e. 2018 over 2017) for the October-November period, the period corresponding to the onset of congestion.
- CN interchange cars for BNSF, CP, and SRY (Southern Railway of British Columbia Limited) increased as a share of total traffic as well. Overall interchange traffic accounted for 25 percent of the 2017 volumes, but increased to 27 percent of the 2018 total inbound volumes (both years in the October to November period).
- CN interchange volumes to BNSF increased 18 percent from (October to January) 2017-18 to (October to January) 2018-19. This included a 16 percent increase in volumes in the October to November 2017 period relative to the October to November 2018 period leading up to the embargoes.
- Excluding intermodal and interchange cars, carloads arrivingFootnote 2 in Vancouver were not concentrated on any one customer. It is noted that in each month between October 2018 and January 2019, each shipper's or terminal's cars accounted for less than 10 percent of the total inbound carloads or platforms received in Thornton Yard.
- The share of CN's non-intermodal customer cars arriving at Thornton Yard fell from a total of 59.6 percent of volumes in the October 2017 to January 2018 period to 53.7 percent in the October 2018 to January 2019 period.
Rail "cars on hand" at Thornton Yard
"Cars on hand" data were requested of CN for the period from October 2018 to January 2019 (Figure 1) in an attempt to identify how many rail cars were in the yard during that time-frame. CN's submitted data for cars on hand in Thornton Yard show:
- The number of carloads on hand started rising in late October 2018 and the majority of delivery delays appear to have affected North Vancouver customers.
- North Vancouver cars on hand rose throughout November 2018 and the first half of December 2018, before falling in mid-December 2018, and then again in January 2019. Cars on hand grew 279 percent from October 1, 2018 through to December 13, 2018.
- Cars on hand in Thornton peaked on December 7, 2018, with North Shore cars accounting for over 40 percent of the total cars on hand that day. This compares to a 28 percent share on October 1, 2018.
- Cars on hand for the North Shore overall peaked a week later, on December 13, 2018, at slightly less than 1,200 cars on that day. This is higher than the approximately 300 cars on hand for the North Shore on October 1, 2018, and the roughly 100 cars on January 29, 2019 (see figure 1).
- Cars on hand were highest for CN's two largest North Vancouver customers: Kinder Morgan's Vancouver Wharves Terminal and Neptune Bulk Terminals, and were also high for Richardson International's Grain Terminal. Cars on hand for these three facilities accounted for 58 percent of North Shore cars on hand on December 13, 2018.
- The data also show that Lynnterm, Univar, and Chemtrade Terminals each had 100 or more cars on hand at Thornton Yard, waiting to be delivered, on December 13, 2018.
The data also show the following:
- Interchange cars accounted for an average of 550 cars on hand per day from October 2018 through to January 2019. This was over 30 percent of all cars on hand at Thornton.
- There were 398 interchange cars on hand at Thornton Yard on October 1, 2018, rising to 927 cars on November 19, 2018.
- Intermodal cars on hand (dwelling in Thornton) represented, on average, two percent of all cars on hand; this is a much smaller share than interchange cars, cars destined to North Vancouver, or those of some of CN's larger customers.
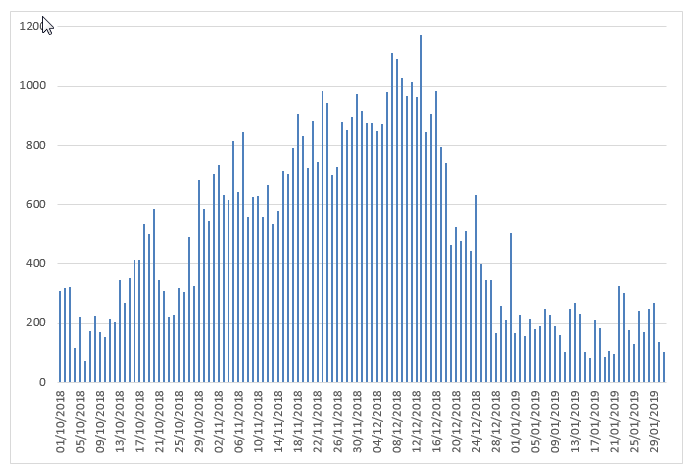
Details
Figure 1 shows the number of carloads on hand at Thornton Yard for delivery to North Shore customers and terminals, beginning on October 1, 2018, and ending on January 31, 2019.
During this period there was considerable growth in the volume of traffic waiting at Thornton for delivery to the North Shore.
There were 309 North Shore cars on-hand on October 1, 2018 dropping to a low of 73 cars on October 6th. The data shows a clear upward trend from October through mid-December, growing to 1,171 cars on December 13th, 2019.
After December 13, the number of cars are hand shows a downward trajectory, dropping to 524 cars on December 20th, and around 200 cars per day in early January.
| Date | Carloads |
|---|---|
| October-01-18 | 309 |
| October-02-18 | 320 |
| October-03-18 | 322 |
| October-04-18 | 115 |
| October-05-18 | 220 |
| October-06-18 | 73 |
| October-07-18 | 174 |
| October-08-18 | 223 |
| October-09-18 | 170 |
| October-10-18 | 152 |
| October-11-18 | 215 |
| October-12-18 | 205 |
| October-13-18 | 345 |
| October-14-18 | 268 |
| October-15-18 | 353 |
| October-16-18 | 412 |
| October-17-18 | 412 |
| October-18-18 | 535 |
| October-19-18 | 501 |
| October-20-18 | 585 |
| October-21-18 | 345 |
| October-22-18 | 308 |
| October-23-18 | 221 |
| October-24-18 | 229 |
| October-25-18 | 317 |
| October-26-18 | 304 |
| October-27-18 | 491 |
| October-28-18 | 325 |
| October-29-18 | 683 |
| October-30-18 | 585 |
| October-31-18 | 545 |
| November-01-18 | 702 |
| November-02-18 | 734 |
| November-03-18 | 632 |
| November-04-18 | 616 |
| November-05-18 | 814 |
| November-06-18 | 643 |
| November-07-18 | 846 |
| November-08-18 | 558 |
| November-09-18 | 625 |
| November-10-18 | 630 |
| November-11-18 | 558 |
| November-12-18 | 666 |
| November-13-18 | 535 |
| November-14-18 | 577 |
| November-15-18 | 715 |
| November-16-18 | 702 |
| November-17-18 | 792 |
| November-18-18 | 906 |
| November-19-18 | 831 |
| November-20-18 | 725 |
| November-21-18 | 883 |
| November-22-18 | 745 |
| November-23-18 | 983 |
| November-24-18 | 944 |
| November-25-18 | 699 |
| November-26-18 | 726 |
| November-27-18 | 880 |
| November-28-18 | 853 |
| November-29-18 | 897 |
| November-30-18 | 973 |
| December-01-18 | 915 |
| December-02-18 | 877 |
| December-03-18 | 874 |
| December-04-18 | 850 |
| December-05-18 | 872 |
| December-06-18 | 980 |
| December-07-18 | 1112 |
| December-08-18 | 1091 |
| December-09-18 | 1027 |
| December-10-18 | 968 |
| December-11-18 | 1014 |
| December-12-18 | 964 |
| December-13-18 | 1171 |
| December-14-18 | 845 |
| December-15-18 | 905 |
| December-16-18 | 985 |
| December-17-18 | 794 |
| December-18-18 | 740 |
| December-19-18 | 463 |
| December-20-18 | 524 |
| December-21-18 | 477 |
| December-22-18 | 511 |
| December-23-18 | 445 |
| December-24-18 | 634 |
| December-25-18 | 398 |
| December-26-18 | 347 |
| December-27-18 | 345 |
| December-28-18 | 168 |
| December-29-18 | 257 |
| December-30-18 | 212 |
| December-31-18 | 503 |
| January-01-19 | 167 |
| January-02-19 | 228 |
| January-03-19 | 156 |
| January-04-19 | 213 |
| January-05-19 | 181 |
| January-06-19 | 191 |
| January-07-19 | 249 |
| January-08-19 | 228 |
| January-09-19 | 228 |
| January-10-19 | 189 |
| January-11-19 | 309 |
| January-12-19 | 248 |
| January-13-19 | 267 |
| January-14-19 | 231 |
| January-15-19 | 102 |
| January-16-19 | 83 |
| January-17-19 | 210 |
| January-18-19 | 184 |
| January-19-19 | 85 |
| January-20-19 | 105 |
| January-21-19 | 97 |
| January-22-19 | 85 |
| January-23-19 | 105 |
| January-24-19 | 178 |
| January-25-19 | 130 |
| January-26-19 | 241 |
| January-27-19 | 169 |
| January-28-19 | 249 |
| January-29-19<1/td> | 267 |
| January-30-19 | 138 |
| January-31-19 | 104 |
Table 1 shows the change in the number of containers and the number of container feet that were ramped onto cars for CN at terminals excluding Roberts Bank. Specifically, it shows the percentage change in the number of containers for the specified time period relative to the same period in the preceding year. Rail cars destined to, or originating from, Roberts Bank could be routed to avoid CN's Thornton Yard, but for all other intermodal terminals in the Greater Vancouver area, rail cars must be routed through CN's Thornton Yard.
| Time Period | % change Containers | % change Container Feet |
|---|---|---|
| October 2017 vs. October 2018 | 11.14% | 9.78% |
| November 2017 vs. November 2018 | 17.79% | 17.20% |
| December 2017 vs. December 2018 | 8.05% | 8.98% |
| January 2018 vs. January 2019 | 8.11% | 8.29% |
|
Total – Period over Periodtable 1 note * |
11.11% | 10.91% |
Table 1 Note
- Note *
-
The number of containers and container feet vary by month (for example, October may have 1,000 containers while November may have 100 containers), the reader will be unable to calculate the "Total" average by taking the average of October, November, December, and January as presented in Table 1 without the confidential numbers.
Table 1 shows an 11.11 percent increase in the number of containers that were routed through CN's Thornton Yard between the time periods of October 2017 to January 2018 and October 2018 to January 2019; this corresponds to an increase in container feet of 10.91 percent. The largest change occurred for November when the number of containers increased by 17.79 percent in November 2018 relative to November 2017.
Vancouver Fraser Port Authority (VFPA) 2018 results show a 4.4 percent increase in total container volumes for the entire year.
The VFPA also reports on-time vessel performance, which is one measure of the effectiveness of a marine system. Tables 2a and 2b show vessel on-time performance at the Port for the months October to December 2018, and annually. Vessel on-time performance declined by 22 percent in 2018, relative to 2017. The results for each month from October to December 2018 were almost 10 percent below the 2018 annual numbers, indicating that the lowest on-time performance occurred during these months.
These results are consistent with the higher volumes of intermodal platforms and container feet discussed above, as the higher volumes contributed to congestion at the Port, interchanges, and Thornton Yard.
| Monthly | 2018 |
|---|---|
| October 2018 | 30.6% |
| November 2018 | 30.8% |
| December 2018 | 29.2% |
| Yearly | 2018 | 2017 | % Change |
|---|---|---|---|
| Annual | 39.2% | 50.5% | -22.4% |
2. Port Terminal Capacity
During the oral hearing, participants suggested that at least some of the congestion issues in the Vancouver area were attributable to the operations of local port terminals/facilities. Specifically, they indicated that port terminals/facilities did not have adequate capacity to unload the rail cars delivered to them.
Consequently, following the oral hearing, the Inquiry Officer requested information from 24 terminals/facilities operating within the Vancouver Port area, of these, 12 responded.
The Inquiry Officer received four responses from terminals operating on Vancouver's South Shore (Alliance Grain Terminals, Cascadia Terminals, Pacific Terminals and Shell). Based on the data provided, Alliance Grain Terminals, for example, received, on average, 100 percent of cars scheduled to arrive during the period from October 2018 to January 2019. For another terminal, average transit times between origin and destination declined by 25 percent from the October 2017 to January 2018 period relative to the October 2018 to January 2019 period.
Based on the information submitted, the Inquiry Officer calculated the "Unused Terminal/Facility Unloading Capacity" for four of the terminals/facilities (i.e. Cargill, Fibreco, Chemtrade, and Richardson) that are served by CN on the North Shore. Specifically, unused terminal/facility unloading capacity was calculated by taking the unloading capacity per day and subtracting the actual deliveries by the railway companies to their terminals/facilities per day as submitted by the terminals.
| Time Period | Cargill, Fibreco and Chemtrade served by CN on the North Shore |
|---|---|
| October 2017-January 2018 | 54 |
| October 2018-January 2019 | 53 |
Table 3 shows that, on average, Cargill, Fibreco and Chemtrade could have unloaded an additional 54 cars per day from October 2017 to January 2018, and an additional 53 cars per day from October 2018 and January 2019. Richardson International Grain Terminal did not provide January 2019 data, but for the October 2017 to December 2017 time period, Richardson had capacity to unload, on average, an extra 132 cars per day. Data submitted by Richardson indicate that between October 2018 and December 2018, Richardson had capacity to unload, on average, an extra 121 cars per day.
Also, the Western Grain Elevator Association (WGEA) submitted information (including emails from certain of their members) to the Inquiry Officer illustrating the alleged effect of CN operational decisions to break up grain trains destined to North Shore terminals. One email submitted by the WGEA indicates that some grain cars that were broken up were stuck in Thornton Yard waiting to be switched onto the correct tracks before they could be moved to the terminal.
Two terminals (Chemtrade and Fibreco) on the North Shore also submitted data allowing the Inquiry Officer to calculate "Unused Terminal/Facility Unloading Capacity" by month. This information is presented in Table 4.
| Time Period | Chemtrade and Fibreco served by CN on the North Shore |
|---|---|
| October 2017 | 45 |
| November 2017 | 52 |
| December 2017 | 51 |
| January 2018 | 49 |
| 2017-2018 Average | 49 |
| October 2018 | 54 |
| November 2018 | 53 |
| December 2018 | 45 |
| January 2019 | 51 |
| 2018-2019 Average | 51 |
Table 4 shows that average Chemtrade and Fibreco unloading capacity was largest in October 2018 when it reached 54 cars per day. In November of 2018, the average was 53 cars per day. In December of 2018 and January of 2019, average Chemtrade and Fibreco unloading capacity per day was 45 cars and 51 cars, respectively.
Three terminals/facilities (Cargill, Chemtrade, and Richardson) on the North Shore submitted data that allowed the Inquiry Officer to calculate the "Delivery Rate", which is the number of cars delivered on a certain date as a percentage of cars scheduled to be delivered or cars requested to be delivered on that date.
| Time Period | Chemtrade and Fibreco served by CN on the North Shore |
|---|---|
| October 2017 | 45 |
| November 2017 | 52 |
Table 5 shows that the average delivery rate (calculated as the number of cars delivered versus scheduled deliveries) for Cargill and Chemtrade was 84 and 79 percent, between October 2017 to January 2018 and October 2018 to January 2019, respectively. Removing Chemtrade from the above analysis shows that Cargill received 83 percent of their planned scheduled deliveries in both periods between October 2017 to January 2018 and between October 2018 to January 2019. Richardson did not provide January data; as such, Richardson received 80 percent of their planned scheduled deliveries in both periods between October 2017 to December 2017 and between October 2018 to December 2018.
| Time Period | 2017-18 | 2018-19 | % Change |
|---|---|---|---|
| October | 100% | 90% | -10% |
| November | 95% | 57% | -40% |
| December | 61% | 64% | 4.9% |
| January | 102% | 103% | 1.0% |
In 2018, Chemtrade delivery rates (Table 6) fell from 90 percent in October 2018 to 57 percent and 64 percent in November 2018 and December 2018, respectively.
Three terminals (Cargill, Chemtrade, and Richardson) on the North Shore submitted data that allowed the Inquiry Officer to calculate "Undelivered Cars", that is, the number of cars that were scheduled or requested to be delivered less the number of cars that were actually delivered.
| Time Period | Cargill and Chemtrade served by CN on the North Shore |
|---|---|
| October 2017 - January 2018 | 14 |
| October 2018 - January 2019 | 17 |
As shown in Table 7, the average undelivered cars for Cargill and Chemtrade was 14 cars per day that were scheduled or requested from CN between October 2017 to January 2018. Between October 2018 and January 2019, this figure rose to 17 cars per day, on average. Richardson did not provide January data. For Richardson, they were short an average of 42 cars per day that were scheduled to arrive from CN between October 2017 to December 2017, and 44 cars per day between October 2018 to December 2018.
One facility (Chemtrade) submitted data that allowed the Inquiry Officer to calculate the delivery rate per month. The information is presented in Table 8.
| Time Period | ChemTrade |
|---|---|
| October 2017 | 0 |
| November 2017 | 1 |
| December 2017 | 15 |
| January 2018 | -1 |
| 2017-2018 Average | 4 |
| October 2018 | 2 |
| November 2018 | 16 |
| December 2018 | 13 |
| January 2019 | -1 |
| 2018-2019 Average | 8 |
Chemtrade reported an increase in the difference between cars received and cars requested from CN in December 2017 when it reached on average, 15 cars per day. In November 2018 and December 2018, this number was 16 cars and 13 cars on average per day, respectively.
At the request of the Inquiry Officer, Lynnterm provided the following information relating to the period between October 1, 2018 to January 31, 2019:
- the total number of cars in the pipeline destined to Lynnterm;
- the total number of cars in Thornton Yard destined to Lynnterm;
- the total number of cars in West Vancouver Yard destined to Lynnterm;
- the total number of cars in Lynn Creek Yard destined to Lynnterm; and
- the total number of cars that Lynnterm was able to unload.
The information provided by Lynnterm showed that during the period of October 1, 2018 to January 31, 2019, Lynnterm had under-utilized railcar unloading capacity. During this same period, volumes of cars destined to Lynnterm increased at Thornton Yard.
Lynnterm suggested that reduced volumes in Lynn Creek Yard of cars available to order meant that Lynn Creek Yard was under-utilized in terms of receiving capacity, which contributed to a build up in the volume of cars in Thornton yard.
Univar provided evidence of days (from October 2017 to January 2018 and October 2018 to January 2019) where it had to order in extra staff to unload cars; it reported this was because CN could not deliver the cars on schedule. Their submission also reported on number of days where the incorrect type of cars were delivered versus what was ordered.
Over the course of the investigation, some terminal operators advised the Inquiry Officer that, for the movement by rail of certain bulk commodities, such as grain, coal, and potash, a terminal authorization is required before railway companies supply and move rail cars ordered by shippers to terminal position. They also suggested that this is meant to ensure a terminal does not exceed its infrastructure limits and has capacity to unload rail cars to a waiting marine vessel, and further that a railway company will normally not move rail cars loaded with these types of commodities forward from origin without this authorization (which is typically supported by a vessel being nominated to fulfil a specific sale).
As well, CN noted in their reply at the oral hearing that port terminals handling "merchandising carload type traffic" (i.e. pulp, paper, lumber, propane, chemicals, and aluminum) do not normally operate on a "terminal authorization" system.
3. Embargoes and Permits
During the oral hearing, railway companies suggested the imposition of an embargo and permit system is a mechanism commonly used to control rail traffic flow, of all or specific commodities, in specific areas or to specific destinations, in an effort to prevent or reduce rail car congestion, thereby ensuring a smoother and more efficient rail transportation system. In contrast, shipper associations have suggested that the use of permits in this time period was excessive and/or discriminatory, and further, that other measures could be used to manage network fluidity, such as ensuring adequate rail fleet sizing and setting of crew levels, planning for contingencies, and making infrastructure improvements.
As reported by participants to the Inquiry Officer, there were effectively three categories or "types" of embargoes put in place from late 2018 to early 2019.
The first "type" of embargo (with permits) was imposed by CN on paper and wood pulp rail cars shipped to Vancouver transload terminals and became effective on various dates beginning around the start of December 2018. CN indicated that they were imposed as a proactive measure to improve network fluidity. CN describes their imposition as an element of its "Terminal Pipeline Management program". CN indicated that impacted customers were given advance notice of the embargoes, on or about September 21, 2018, and were provided information on how the program would be executed, including how requests for permits should be made. CN implemented a similar program for wood pulp and paper during the same time period in 2017.
As per Table 9, the data show an increase in wood pulp shipments in October and November 2018, and declines in December 2018.
| Month | 2017 | 2018 | % Change (2018/2017) |
|---|---|---|---|
| October - November | 1,662 | 1,932 | 16.25% |
| December | 955 | 937 | -1.88% |
The second "type" of embargo (with permits) was implemented by CN, starting on December 2, 2018, affecting the New Westminster interchange with BNSF, two transload terminals in the Greater Vancouver area, and a terminal on the North Shore. These embargoes impacted all categories of traffic. CN explains they were put in place in response to congestion issues in the area.
The third embargo "type" was imposed by CP (initially without permits, but later with permits) which targeted wood pulp traffic to destination terminals that were subject to CN's embargoes affecting wood pulp shipments. CP also placed an embargo on a transload facility, which CP indicated was due to excess volume from shippers trying to avoid CN embargoed terminals.
During their presentation at the hearing, CN told the Agency that the decision to deploy embargoes and permits was made to respond to "inconsistent rail car unloading operations at some Vancouver area terminals - particularly those handling forestry products, which contributed to congestion in parts of the Vancouver rail network, resulting in service delays for other shippers."
CP described the imposition of an embargo and permit system as “a tool of last resort,” and an effective way to control inbound traffic to areas that are operationally impaired.
In regard to the October 2018 to January 2019 period, a graphic prepared and submitted by CN to the Inquiry Officer (Figure 2) shows rail car congestion started around the last week of October 2018 and peaked in the first weeks of December 2018.
Figure 2 shows inbound rail car dwell time declined following CN's imposition of embargoes with permits.

Details
The figure shows the number of cars arriving daily, car on hand for placement, and the level of inbound dwell (in hours) from September 2018 through January 2019.
Cars arriving per day shows little variation over the time period, showing a slight decline immediately following the December embargoes, but rebound in early January.
Cars on hand increases from October through to mid December before falling through the second half of December and January.
Inbound Dwell time shows a very similar trend to Cars on hand, but with a slight time lag. Inbound dwell begins at roughly 35 hours per car in September before rising to over 70 hours per car in mid-December. From that peak, the data then indicate a consistent decline to a low of roughly 25 hours per car in mid January.
CN and CP reported their use of permits was in accordance with the Association of American Railroads (AAR) Rules. Given this, the Inquiry Officer contacted the United States Surface Transportation Board (STB) for additional information. STB officials advised that, at any point in time, there are well over 100 temporary embargoes in place across the U.S. rail network. In the last year or so, STB officials noticed embargoes were being imposed as a tool to manage rail traffic, which is something for which they had not been used previously. In the past, the STB explained, embargoes and permits were principally used in response to major events, such as a bridge wash-out or a derailment, and not as a means to manage congestion. Finally, STB officials said it has been over ten years since the STB received a complaint regarding an embargo or permit.
- Date modified: